522
Views & Citations10
Likes & Shares
H10: Health determinants do not affect the demand for health insurance.
H20: People are not willingness to pay for health insurance.
Significance
The beneficiaries from my paper will be those individuals and household who like to have health insurance policy or health reform by sacrificing little amount from there total income. Deprived people of Khyber Pakhtunkhwa will take peace of breath through health reform. Passing Background and Introduction about the topic.
Health is the most important pillar of the society. Different countries had different doctrines about health services. Developed nations, like United States of America 17.9%, France 11.7%, Switzerland 11.3%, Germany 11.3%, Denmark 11.2%, Japan 10.1%, Belgium 10.8%, Canada 10.9% and United Kingdom 9.4% spend their GDP on health services (Health expenditure, total % of GDP, 2015). Health services in above mentioned countries are mostly financed through Income tax. In Pakistan when 2% of the entire population pays income tax, how we can spend money on education, environment, social and technological reform (Tavernise, 2010). Pakistani government (either military or democratically elected) fails to introduce universal health reform in Pakistan, nation where for 1000 patients only 1 doctor is available, despite increase in number of government and private medical collages (Naqvi, 2012). Pakistan is listed on top, report by Save the Children (Pakistan has the highest rate of first day deaths, 2014), in which Pakistan is in the lead 400 a day-old baby died out of 1000 followed by Nigeria 327 out of 1000, Sierra Leone 308 out of 1000 and Afghanistan 290 out of 1000. Indeed increase in number of medical colleges will decrease burden per doctor (1 doctor for 1000 patients) but it will not be affective until and unless government take step(s) towards universal health reforms. Pakistan, 188 million of population spends 1% of its total GDP on health services (World Population Review, 2015; Wasay, 2009). In Pakistan 33% of total population has hypertension, 25% of patients over 45 years suffered from Diabetes, hearth stroke is 250/100,000.
Having chronic life taking diseases there is need of health reform at individual, household, district, provincial and on country level. Diseases like Respiratory infection, Diarrhea/Dysentery, fever (viral, bacterial, travel fever, blood clot fever etc.), Hypertension, Asthma, Dental, Diabetes, Heart attacks, Obesity, Kidney, and Urinary Tract Infections are Pakistan top ten chronic diseases. In many under developed nations and absence of sufficient medical awareness among individuals such diseases after maturity creates several socio and economic problems for households as well members of the household.
In-order to introduce health reforms, needed investigation will be required about health determinants in Pakistan, because if government introduces health insurance policy for entire population they must have basic health determinants data in their data base before introducing health insurance or health reform. Health determinants act as trajectory towards health reform.
This paper is divided into two parts. The first part will focus on finding the determinants of health of individual and household, while the second part will focus on the people willingness. Importance of first part of the study is that no one in Pakistan able to take empirical research work determinants of health. There are basically four determinants of health, which includes economic, social, environmental and political determinants. The last part of the study is important too. Indeed willingness to pay, studies has been conducted in Pakistan for different research areas. As far as my research work is concerned willingness to pay (WTP) an economic concept, which will help public and private sector to know bird eye-view about how people state their preference if government announce policy change. Reason for incorporation of WTP in this paper is that, in developed countries health is mostly financed through taxes, unfortunately in Pakistan only 2% of entire population is paying income tax. When 2% of the entire population is paying tax, how government can finance health services to entire population. That is why need of public interest is necessary, because currently every Pakistani owes Rs 82, 627 (Hasan, 2014), in this case it is not possible for government to provide health insurance to its entire nation. So, if government and public bear equal or more or less cost of health services, then it will have a positive impact on government treasury. If health insurance or health reforms are introduce in the coming future both parties (government and nationals) will better-off. Pakistan is in state of war and in such condition when un-employment, inflation, death rate, food insecurity, water borne diseases and many others curbs on social and economic road of a country there is need to bring health insurance for Pakistani nationals (Shah, 2012), without further delay Pakistan need to bring innovative health financing scheme as soon as possible. Lack of hospitals, medical staff and paramount drugs prices are key factors for increasing mortality and morbidity in Pakistan. Sania, (2011) demanded from Government of Pakistan to bring public or private health insurance sector in the economy in order to support middle, and poor class health. In Pakistan middle class and poor class who are not part of government or private sectors are facing problems while going to hospitals. If there is health policy through which people are insured medically and their treatment cost minimized then the scale of Pakistan GDP will increases, mortality and morbidity ratio will be remain lower.
Despite limited access to education and limited knowledge about health insurance, people of Afghanistan are willing to join and pay for health insurance (Behzad & Sayedi, 2022). Out-of pocket health expenditures can be reducing significantly by instituting a national health-insurance program. Data was primary in nature and was collected from eight district of Afghanistan, with a total sample of 2,635 individuals. Two options (Dependent variables were dichotomous) were given i.e. M1 (include all prescription medicines) and M2 (only prescriptions from a list of essential medicines). Regression shows significant differences between the provinces. Respondents from Balkh (44%) were willing to pay more compared to Kabul and rest of the provinces. More than 85% respondent positively towards WTP for health insurance, average amount which people were willing to pay for attaining health insurance was AFN 1,236 (US$21.30) per person per year. Paper highlighted that before initiating health reforms, there need to address social inequalities.
Paper by Miti & Perkio, (2020) in which it was established that trust and income were associated with Willingness to pay for both health insurance and pension schemes. Other variables like size of the family, age and education were common factors for both groups. Data was taken from 17 countries with 34 studies out of which 23 studies focused on health insurance, 4 studies on social security and 7 studies on pension schemes. Results from the studies shows that there is a complex web of relations between the factors influencing WTP for health insurance and pensions holders.
Birth, growth, live, work, neighborhood, age and communities are the basic social determinants of health (Khattak, 2013). In every country, constitution gives its nationals to have equal rights in health, education, food and shelter. As signatory of Millennium Development Goals (MDGs) Pakistan government is trying hard to achieve MDGs before 2015. Social determinants of health depend mainly on income and by logic there is inverse relationship between poverty and income; increase in poverty leads to decrease in providing health services and health services are provided through financial assistance. Challenges and hurdles for Pakistan to obtain MDGs are monitor and control on chronic diseases, improve child and mother care, social and economic inequalities, good governance, central and provincial role and most importantly lack of awareness. Pakistan spends 1% of its GDP on health services as compare to Afghanistan which spend 1.8% of its GDP on health services. Author suggest that increasing budget for health programs, community support honest health management staff and increase in health expenditures in efficient way will bring positive role in decreasing mortality and morbidity, chronic diseases, poor sanitation, food, shelter and education.
Developed nations are spending more and more on their health services every year, and conduct many empirical studies so that they can attain people attitude towards health and analyze outcomes from health spending (Nganda, 2005). Individual and house-hold survey was conducted in South Africa. Aim of the study was to find out the determinants of health insurance. House-hold women and female individuals were targeted. 3,489 Women between 16-64 years were interviewed through cross-sectional data collection procedure with-out knowing insured and uninsured house-hold and individuals. In 2003/2004 financial year budget, South African government spends 61.3% on health expenditure. On health services US$6.15 billion were spend on HIV/AIDS, nutrition, emergency services, administration services, primary health and house medical services for kids and aged people. Determinants for health insurance were obtained through 5 factors; those factors were economic factors, demographic factors, social factors, environment factors and behavioral factors. Economic factors include income, occupation and employment. Demographic factors include age, house-hold size and age squared. Social factors include education, marital status. Environment factors include residence and environment rating and last one was behavioral factors which include, Drugs, alcohol and criminal factors. During the survey, respondent were first given brief view about aim of the study and what will be the shape of post health insurance benefits and were directed to state their answers truly so that data manipulation and other discrepancies be avoided. Study found that 6.1% were happy from their health insurance providers. Chi-square test was use for goodness of fit along with Logit model. Result from data shows that area, income, education, environment, smoking, marital status and age were all statistically significant. Paper fail to provide documentation about health insurance premium, co-payments, number of chronic diseases cover in health insurance policy and either health insurance policy is mixed i.e., India; in terms of purchasing power parity is listed fifth amongst 184 countries. As economy is proceeding in a right direction there is need of watchdogs for health reform too. Health sector required attention so that people living in deprived areas of India can attain maximum health services. India spends its 6% of total GDP on health sector. Public healthcare expenditure is just 0.9% of GDP. Private health sector spend 80% on health expenditure. This paper objective was to analyze the factors which determine the demand for micro-health insurance scheme in Anand district of Gujarat, India; where “Charutar Arogya Mandal” provides micro-health insurance. The study was examined through two stages. In the first stage, determine the factors which affect the insurance purchasing decision and in the last stage determine the factors which affect the amount of insurance purchase while using Heckman two-stage estimation procedure. Primary data was collected from Anand district Gujarat. Econometrics analysis was used to find out the factors affecting health insurance purchasing decision. Two choices were given to respondent in the early stage, either to buy health insurance or not to buy health insurance. If respondent shows his willingness for buying health insurance then second option was how many people in the same family is going to buy health insurance along with kind of health coverage added to health insurance scheme. The Logit model was used instead of simple OLS regression model, because here in this study there were two dependent variables in the model, so, due to binary relationship of variables (1 is use as positive choice and 0 is use as negative choice). So in the first model Logit or Probit econometric models were used. OLS model was used in the second model. Independent variables which were used in both equations apart from health expenditure (As they are uncontrolled variables) were age, gender, education, number of children’s, number of family member(s). During data collection, respondent were asked to rate cost, quality, accessibility, illness coverage, health services coverage, trust, illness expenditure and knowledge about health expenditures mentioned variables on the scale of one to five. Sample of 301households were interviewed during data collection, out of which 101 households were not insured while 200 were insured. Results were significant in case of income, health expenditure, education and illness coverage for household. Determinants like income, educational status (More educated ones like to have health insurance) and fulltime job employment are the key factors for individuals and households to have health insurance (Gius, 2010). Paper aim was to examine the determinants of health insurance coverage for young adults of Connecticut, United States of America. Cross-sectional interview was conducted in which 35,000 households with over 87,500 persons were interviewed from National Health Interview Survey (NHIS) for Connecticut State in 2008. Data was collected from two age groups, 18-24 age groups and 25-29. Dependent variables like age (as age of the person increases demand for health insurance increases), sex (female as compare to male are likely to have health insurance), marital status (married couple would likely to have health insurance), health status (poor healthy person demand more health insurance as compare to healthy one), race (discrimination for African-Americans might not have insurance), Income (higher income means, likely to have health insurance), poor [(if income of the person is less than $25,000 (1) will be awarded otherwise (0)]. Data was estimated through Logit model. Those whose age was between 18-24 years, in which 66.9% were having health insurance out of which 17% were African-American, the average age was 20.9 in which only 3.7% were able to purchase their self- insurance policy, 31.7% worked full time. For 24-29 age group 68.8% had health insurance, out of which 14.8% were African-American, 59% working full time. In some States of America, there is still racism present for African-American. Those African-American whose income level is less or doing part time jobs then person is not able for health insurance. Results also show that, person who is healthier is likely to have health insurance as compare to less healthier one Poursamad, (2013) compared the attitude of insurers and non-insurers towards health insurance. According to them health insurance improves the lives and health of people and it provides medical treatment on time. In order to test whether insurers have favorable attitude towards health insurance, they employed a contingency coefficient. It helps to find the association between respondents and their responses. A stratified random sampling technique was used. A total of 401 respondents were selected, of which 200 were insurers and 201 were non-insurers. Respondents were asked questions regarding the availability, expenditure time and treatment aspects. Their results suggested that insurers had favorable attitude towards health insurance than non-insurers.
Socio-economic determinants of health insurance by taking Kunyakumari district, Tamil Nadu, India (Binju A. V., 2013). Contract between insured and insurer for health services is known as health insurance. Insurer provides health services while insured provide premium amount in lump sum or full payment on time. This paper was based on the socio-economic determinants of health insurance by taking Kunyakumari district, Tamil Nadu, India. Primary data was collected from Kunyakumari district. Data was analysis through Chi-square test and F-test. Kunyakumari district, four Taluks (Tehsil), Agastheeswaram (21%) Thovalai (23%), Kalkulam (29%) and Vilavancode (27%) were taken for data collection from 150 respondents randomly selected for well-structured questionnaire interview. Result from data shows that there is inequity present between four tehsils due to income level. Age, number of family members, education, income and awareness among four tehsils were key points for determinants of health insurance. Low income was the key factor for people of Kunyakumari districts. Others social and economic determinants factors signs were significant for Kunyakumari districts.
In case of India (Malani, 2014), Indian government introduce health insurance scheme Rashtriya Swasthya Bima Yojna (RSBY) in April 2008. RSBY is health insurance scheme for those Indian communities who are Below Poverty Level (BPL). This scheme was introduced to those Indians who are far away from health services or not able to have health insurance policy due to economic and social constrains. Paper aim was to monitor the determinants of household participation and their enrollment in RSBY scheme. Survey was conducted at districts level, in which 600,000 household from 384 districts of 22 states were interviewed. Each district household was socioeconomically measure through available attributes; like availability of roads, electricity, education level and availability and accessibility of RSBY scheme in each village of district. Inclusions of socioeconomic, political and official factors were used as explanatory variables in Probit and OLS models. District Level Household Survey (DLHS) data; data about size of households, castes (Muslim, Christian, Sikh, Hindu and Buddhist), infrastructure and other attributes were added to questioners. Standard of living of the households in each 384 districts assets index was used for DLHS. Tangible assets like radio, sewing machine, TV, car, bicycle, computer or laptop and other tangible staffs, along with surrounding environment and literacy index like quality of air, water taste, sanitation and roads standard. A result from multivariate Probit and OLS analyses concludes that, the political and institutional factors are the sturdiest factors of participation and enrolment for RSBY scheme. As the level of income increases people like to enrolled in RSBY scheme or may go to more protective (Private or semi-governmental organization) health insurance provider, because as the level of income increases demand for more health services increases. National Health Insurance Fund (NHIF) was established in 1995 in Sudan, argument from (Dahlui, 2014). Paper stands on finding factors behind enrolment in insurance scheme and barriers for Universal health reform Data was obtained from Sudan Health Utilization and Expenditure Household Survey (SHUEHS) in 2009. Survey was conducted from 72,526 individuals from 12,000 households nationwide. For data analysis Chi square test and bivariate were used for describing the characteristics of insured and un-insured. Multivariate Logistic regression was used to identify the factors explaining insurance enrolment. From 72,526 Sudanese just 14,461 (19.9%) were insured. As survey was conducted nationwide only Khartoum capital of Sudan 34% were having insurance membership. The disparity among rural and urban population i.e. 16.9% of rural population were insured as compared to urban areas which was 25.3%. Result shows that 80% are the chances for that civil servant to enroll in health insurance scheme as compare to those who are not civil servant or higher grade government employee. University and higher education student’s chances are more than primary education students. Diabetic and hypertension patients are more likely to be insured. The socioeconomic status mostly rich family is not much exposed to lethal diseases (Karolyn, 2011). Increased obesity was related to low income family. Low income leads to poor quality of food, and poor quality food nourished diseases and finally the demand for health care increases and to sponsor health care for such class health expenditure increases. Environment and health are correlated to each-others, better environment leads to better health and better health leads to increase man power and finally man power leads to increase income. Authors like Corvalan, Kjellstrom, & Smith, (2008) state that, from historical point of view data shows that decline in morbidity and mortality is due to changes in health determinants. Determinants like small family size, clean water, poor sanitation, improvement in nutrition’s.
After going through determinants of health now we turn our attention towards the second part of the study i.e. Willingness to pay (WTP) for health insurance. Before going through literature work let us assume Khyber Pakhtun Khwa government introduce health insurance policy for its provincial nationals and KP government asked KP resident or Household to pay PKR300 per month and take health insurance policy, are you willing to pay this much amount per month. The following example tell us about the Stated Preference i.e. how people state their preference for a policy change. For a policy change government always looks forward towards people response, how people will react towards policy change. Health in developed countries is mainly financed through taxes, but ill-fated collections of tax in Pakistan take away incorporation of health insurance policy. Developed and developing countries government or local organizations conduct surveys for WTP for health policy reform (Munoz, 2003). Paper reconnoiters north-western part of Tanzania about the willingness to pay for rural district hospital services. Survey was conducted in which 500 outpatients were interviews and 293 inpatients from three district level hospitals, households were also interviewed in which 1500 households were randomly selected. Information regarding people willingness to pay for better treatment in district level hospitals was collected. Most respondents favored local insurance systems. Female were in favor of local insurance policy. The respondents were willing to pay if government tries to introduce health insurance or provide low cost medical facilities in district hospitals. People from rural areas Iranian government try to investigate about health reform. In recent time Iranian government try bring reform in health sector, by targeting rural population (Taghvaei, 2004). As there is problem of small budget allocation for health sector, developing countries there is need of such health policies which in short and long terms be beneficial for rural communities’ health. Iranian government tried to introduce health insurance program for people of rural areas. This study aims to convey demand and willingness to pay for health insurance through contingent valuation method by using iterative bidding game technique. Primary data was collected from 2,139 household’s crossways country. Household’s willingness to pay for health insurance was estimated through multiple linear regressions. Questioners were divided into two parts: first part was related to general characteristics of the rural areas and availability of the public facilities. Second part was related to household characteristics. Most of the exogenous variables show positive (significant) relationship with the health insurance policy. Health insurance paly key role In Punjab, India study was conducted Bawa, (2011) present study was conducted in order to see three aspect of Health insurance, the study examines the respondents who are aware or not aware about health insurance, those who were aware of the health policy have insurance policy or not, third who not succeed to get health insurance what are the reasons behind not to take health insurance, last to check people willingness towards health insurance are they willing to accept or not willing to accept. The study was carried out in Punjab, 600 was sample size people were randomly selected. Lack of awareness and willingness to pay was main barrier for providing health insurance. Poor financial and lack of awareness, political turmoil, and most importantly people participation for acquiring health insurance was key outcomes from paper (Yellaiah J, 2012). Health insurance is one of the most important aspects of health management system. Paper identifies the socio economic factors for demand for health insurance taking Hyderabad (India) as targeted area. A sample survey was conducted in which 200 samples size were targeted. The ages of the respondents were between “30-40”. The reason for targeting such age group was family dependency on earners. Using primary data from households, on the basis of structured questionnaire data were collected from the people of Andhra Pradesh city of Hyderabad. The logistic model was used for the identification of health insurance determinants; the result shows that main determinants for health insurance in Hyderabad were occupation, income, and health expenditures and people awareness towards health insurance. Logit model was use for determining the demand for health insurance, and find out people willingness (purchasing) and not willingness (not purchasing) health insurance. House hold willingness was dependent variable. The model which they use was based upon different factors which affect people willingness for health insurance to buy. The result shows that health insurance minimizes the burden of health expenditure significantly for poor class family, which entails increases productivity, decreases morbidity and mortality, secure family health as well as key participants in the development of country GDP. Countries like United States of America and Japan they too asked for WTP from there nationals for certain fatal illness, (Milligan & Bohara, 2010). The research was conducted in the United States of America, where Cancer is listed second leading chronic disease. Cost of cancer all over the world is high but in U.S the cost is far more than rest of the world. The paper objective was to analyze the socioeconomic and demographic factors which can bring about people willingness to pay for cancer prevention. Experimental data was carried out in 2002 from Health & Retirement Study (HRS) to find out people WTP across different population. Main question of survey was how much people are willing to pay certain amount per month for reduction of caner diseases. The result from the survey shows that income and willingness are positively correlated. In survey HRS add policy based questioners, and ask respondents how much they are willing to pay for such medical drugs which can medicate cancer diseases. In survey patients facing other diseases like skin, allergy, or currently diagnosed with cancer were not included in survey. Regression analysis was use to check WTP for cancer prevention. Bidding was introduced for respondent WTP amount. WTP fit into different categories, ordered Logit model was use, but it will ignore boundary point values. Threshold modeling (a model in which value is set i.e. minimum and maximum limit) approach was use. Two models were utilized; the first one was to check the socioeconomic & demographic factors, related to WTP. In first model respondent WTP with natural log is linear function of explanatory variables. The second model was incorporated to test self-assed probabilities of upward cancer in future by using simultaneous equation. The result shows that income and WTP is positively correlated, as income increases people are willing to pay more. About 75% people were willing to pay $100 amount per month, 10% people whose income is maximum were willing to pay $1,000 amount per month. Health insurance is one of the most important aspects of health management system. Yellaiah J, (2012) paper identifies the socio economic factors for demand for health insurance taking Hyderabad (India) as targeted area. A sample survey was conducted in which 200 samples size were targeted. The ages of the respondents were between “30-40”. The reason for targeting such age group was family dependency on earners. Using primary data from households, on the basis of structured questionnaire data were collected from the people of Andhra Pradesh city of Hyderabad. The logistic model was used for the identification of health insurance determinants; the result shows that main determinants for health insurance in Hyderabad were occupation, income, and health expenditures and people awareness towards health insurance. Logit model was use for determining the demand for health insurance, and find out people willingness (purchasing) and not willingness (not purchasing) health insurance. House hold willingness was dependent variable. The model which they use was based upon different factors which affect people willingness for health insurance to buy. The result shows that health insurance minimizes the burden of health expenditure significantly for poor class family, which entails increases productivity, decreases morbidity and mortality, secure family health as well as key participants in the development of country GDP.
Contract between insured and insurer for health services is known as health insurance (Binju A. V., 2013). Insurer provides health services while insured provide premium amount in lump sum or full payment on time. This paper was based on the socio-economic determinants of health insurance by taking Kanyakumari district, Tamil Nadu, India. Primary data was collected from Kanyakumari district. Data was analysis through Chi-square test and F-test. Kanyakumari district, four Taluks (Tehsil), Agastheeswaram (21%) Thovalai (23%), Kalkulam (29%) and Vilavancode (27%) were taken for data collection from 150 respondents randomly selected for well-structured questionnaire interview. Result from data shows that there is inequity present between four tehsils due to income level. Age, number of family members, education, income and awareness among four tehsils were key points for determinants of health insurance. Low income was the key factor for people of Kanyakumari districts. Others social and economic determinants factors signs were significant for Kunyakumari districts.
OBJECTIVE OF THE STUDY
To analyze the determinants of health insurance in targeted areas.
To provide ground realities for government institution’s, if in future they need to bring health insurance or want to see people reaction towards policy reform in future, such study will play vital role for improvisation of such policy on basis of empirical evidences.
Data collection and data analysis
Primary data was collected through designed questionnaires and was collected from 280 IHH. Initially pilot survey was conducted in three areas in which 30 samples from each of three areas were collected. By analyzing data and information collected during pilot survey questionnaires was further designed by incorporating received information.
Problem statement
Pakistan is in different tornados. Tornados like socio-economic, political instability, terrorism, environmental and health issues. From 14th of August 1947 Pakistan got independence from India, till date no governments neither current nor past have been able to introduce health policy for their nationals. Now this time, this paper will address determinants of health insurance and issues or reasons behind people insofar not been able to have health insurance. So, if current government or next government likes to introduce health reform or health insurance, this research work and its empirical result will help government to see demand along with willingness to pay for health insurance and people thrust towards health insurance.
Through mayhem, lawlessness and stagnate socio-economic activities in the province, this policy will be omen for their coming future. Health burden will be decrease, as a result income will be save, this save income will spend in different sectors, as whole we will have revived Khyber Pakhtunkhwa as it was fifteen years back, a prosperous, rich culture and most importantly a gate for local and international tourist.
Limitation of the study
For many researchers there are limitations related to current study. The very first limitation is lack of literature related to willingness to pay for health insurance. As this model is new to health insurance therefore literature about willingness to pay need more evidence. Second limitation is sample size, although statistical calculation was taken in hermetical way but loops are always there. Third limitation is people counterfeit data about family and willingness to pay for health insurance. Due to flux in Peshawar and search operation people may not be able to provide authentic data.
The production of health
Resource allocation, to produce health was constructively given by Michael Grossman (1972a, 1972b)). His work was firmly appreciated, due to variables which were not taking before his work, and such variables like, age, education, health status, environment and income were taken by Michael Grossman and his model enable many researchers to what extend an individual's allocate their resources for the sake of health. His theory was based on human capital. Individuals invest money on education then training and finally health, by the combinations of tri parts individual earn money. According to Grossman (1972a, 1972b) he divided human health in to two groups i.e. health as consumption and health as investment. Health as consumption means, person having good health feel better. The last part health as investment means, good health increases number of working days, and as the number of working days increases income level increases. A human body for instance, take it as investment firm, and as firm depends on capital, labor knowledge, market knowledge, opportunities and many other variables, such equation applies to human health, which depends on diet, exercise, environment, time and other physical and mental activities, as human body listed above variables works the output level i.e. working days increases. Time is taken because of "Law of diminishing return" applied to human health too. As time span (no economic activity), from neonatal to mature (boom period) and from mature to old ages (diminishing returns) health output decreases. Grossman states that as the age increases, demand for health services increases as the same time income level decreases, mostly people at retirement age, they demand for more health care than the rest of the years. The level of education is also play the key role in determining demand for health. There is positive relationship between demand for health and level of education. As the education level increases demand for health increases. More educated people like to have more health stock vice versa. Others researchers like Gerdtham & Johannesson, (1999) lauded theoretical prediction about demand for health increases with income, education and decreases along with overweight and being as a single. Drugs like smoking, alcoholism, and others illegal drugs decrease the demand for health services, likewise the relationship between income, alcoholism and working days (Mullahy & Sindelar, 1993) state that poor health due to excessive use of alcohol, decreases productivity or working hours which decreases income and finally investment on health decreases (Gerald, 2010). The health stock here is treated as the investment as well as the consumption good. Consumption good yields direct utility while the investment good yields indirect utility in the form market goods i.e. is higher productivity, less number of sick days and ultimately higher wages.
H
Where I: Investment on Health; M: Market Health Inputs (Medical Services, Lifesaving drugs); TH: Time Spent Improving Health
B
Where B: Home Good Production (Reading, Watching television); X: Market Goods Necessary for the Production of the Home Good; TB: Time Spent in Producing the Home Good
First thing which strike to mind is income level, as income is the only source through which individual or household opt for health services. Second is level of education; education provides awareness towards health services, the more number of educated members in the household more individual will demand for health services.
In order to develop empirical back ground of the model for health demand, there is need to identify the individual determinants of health. Others variables like environment, political seriousness towards health services, people involvement, and most importantly awareness about health services are found in (Shah, 2012; Sania, 2011; Khattak, 2013; Nganda, 2005; Bhat, 2007) which were not available in Grossman health model. These and other determinants of health will be further discussed in this paper.
The demand equation for health insurance can be modeled as
Where DHI shows demand for health insurance which is the function of economic factor, demographic factor, social factor, environmental factor, behavioral factor and political factors. The independent variables listed in equation (1) will be used as:
- Economic factors include income, occupation, and employment.
- Demographic factors includes age of the household, maximum and minimum age (children below five and aged members of family likely to have health insurance and are mostly attack from diseases due to low immunity level in body), sex, number of male and female, number of physical disorder patient.
- Social factors include education, degree of education (primary, secondary and higher education) and marital status.
- Environmental factors includes condition of house, water quality (dummy variable if water quality is good then 1 otherwise 0), sanitation (dummy variable if proper sanitation is there than 1 otherwise 0), environmental rating (if air is fresh and good for health 1 will be awarded otherwise 0).
- Behavioral factor includes, use of Drugs (individual or family members, if use than 1 otherwise 0), past or current criminal record (clean track record 1 will be awarded otherwise 0).
- Political factors includes (satisfaction from current government policy, health incentive if yes otherwise No, was previous government better than current government).
Data and Data Collection
Before conducting survey, time and area are the basic parameters for data collection. Reason is that now days due to military operation in tribal areas and police search operations near Peshawar villages, are the main barriers for data collection. As data was collected from individuals-households, so, in-order to take safety, and most importantly time parameter, data from rural areas was collected from Mullahzoo, while for urban areas Hayatabad and Fakirabad. Due to mass Afghan migration Mullahzoo, Fakirabad, and Hayatabad (Phase 1, Phase 3, were not conducted for data collections because numbers of Afghan nationals are living there). Pilot survey was conducted in three targeted areas of Peshawar, so, if there exits some loopholes in questionnaires, it will be addressed on time.
Primary data was collected through designed questionnaires and was collected from 280 IHH. Initially pilot survey was conducted in three areas in which 30 samples from each of three areas were collected. By analyzing data and information collected during pilot survey questionnaires was further designed by incorporating received information.
Sample Size and Sampling Technique
Data has been collected from rural and urban areas of district Peshawar. Stratified random sampling method was used to select rural and urban areas. One rural areas of the district i.e. Mullahzo, and two urban areas i.e. Hayatabad and Fakirabad are chosen for data collection. The reasons why these areas are selected for data collection are;
- Due to small areas (by population), as compared to rest of KP rural and urban areas, data will be collected in a detail because as small household size opportunity to take detail interview will be possible.
- These areas are the representative areas of the rural and urban areas of the district. Other parts include migrants from inside and outside of Pakistan.
- Three areas are near to major hospitals (Mullahzoo is near to Sherpao/Khyber Teaching Hospital, Hayatabad is near to Complex Medical Hospital, and Fakirabad is near to Lady Reading Hospital), because in questionnaires there was portion related to hospitalization cost, and residents of three areas frequently visit these major hospitals.
The sample size is systematically selected by using the formula
Where n: Sample Size; N: Population Size
The formal derivation of the sample size for each of these research areas are given the Appendix at the end of the dissertation
Where, B: Bound on the error of estimation = 0.05
A total of 280 households have been selected, 138 from the urban areas of research and 72 from all the rural areas of research. The households are selected by using systematic sampling (e.g. every Kth unit) from a list of total households of the areas of research. Sample size (n), can be defined as selecting every Kth household from the total population (N), arranged in order.
The letter, K, called as the sampling interval can be written as:
Where, N: Population Size; N: Sample Size; K: Sampling Interval
K could be any number nearer to integer (e.g. every tenth or every twentieth unit etc.) and every Kth unit from the list of population was selected. Using the above formula for all the five areas, the results are shown in table below;
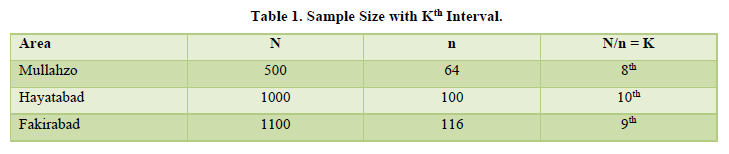
Table 1 above shows that for Mullahzo (8th); Hayatabad (10th) and Fakirabad (9th) household are selected for data collection, respectively. Systematic sampling technique was used because of the reason that it saved much of the time and efforts, it was economical, and was convenient to select a sample from the already prepared list of population and just had to tick them.
Econometrics model and Data analysis
In order to justify my data, I will use Logit model. The Logit model will be used instead of simple OLS regression model, because here in this study there are two dependent variables in the model. So, due to binary relationship of variables (1 is use as positive choice i.e. yes I will demand for health insurance and 0 is use as negative choice which means I will not demand health insurance). The model will also use other independent variables too which will for sure influence demand for health insurance.
Data and Econometric model
Current study was carried out in three areas of Peshawar which include Mullahzo, Fakirabad and Hayatabad. Total of 280 individuals household were interviewed for data collection, out of 280 total individual data 276 were taken in data analysis. The remaining 4 were outlier which were creating problem of Multicollineraty. As main objective of study was to analyze determinants of health insurance first, then and willingness to pay for health insurance, so to main determinants for demand for health insurance which were taken in this study were educational level, marital status, age, children, total number of people living in a house, income and one key variable which was taken environmental part was air quality. For this study logistic regression model was incorporated due to binary nature of dependent variable i.e. demand for health insurance (if Yes then 1, 0 otherwise). The following Table 2 will describe nature of variable.
Variables Explanations
From Table 2 DHI (Demand for Health Insurance) is taken as DV (Dependent Variable) having dichotomous nature (1 and 0). Here 1 stands for positive sign for demand for health insurance, while 0 stand for not demanding health insurance. Our IV (Independent Variables) are Age which is taken in terms of real age not in categorical form, Age_2 means age square, shows that if real age is taken in square form then will they demand for health insurance, EL (Education level) is taken in categorical form TNPL (Total Number of People Living) is in figure form, how many people are living in a house, AQ (Air Quality) is taken as dummy variables (1 and 0) 1 stands for Good and 0 stands for Bad or un-breathable. INC (Income) was taken as total monthly income, C (Children’s) was taken in dummy form and last variable was MS (Marital Status) if individual is married then 1, otherwise 0.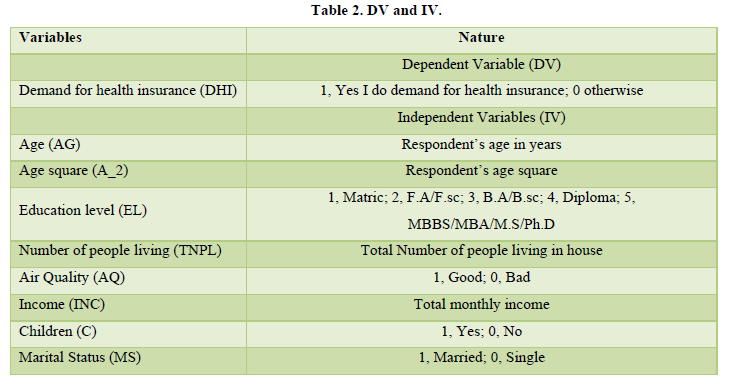
Econometric Model
Factors which affecting the demand for health insurance, a logistic regression model has been used for individual household data analysis. Model uses other independent variables which are attributes for creating demand for health insurance.
(1)
Where, Pi: Probability of demand for health insurance; b1: Constant term; bk: Coefficients; Xk: for k = 1…..8, are the independent variables and i shows subscript ith observation; K1: Age; K2: Education level; K3: Income; K4: Marital status; K5: Age squared; K6: Total number of people living in house; K7: Air Quality; K8: Children
Let, (2)
Then, (3)
Where Zi ranges from -∞ to +∞, Pi ranges from 0 to 1 as Pi is non-linearly related to Zi.
Where in equation (4) L shows logit, it shows how odds are in favor of demand for health insurance with respect to change in independent variables.
(4)
DATA ANALYSIS
Introduction
Cross sectional data collected through stratified random sampling technique was used during data collection. Data from 280 households from Mullahzoo, Fakirabad and Hayatabad, three different areas of Peshawar were interviewed. Three different areas of Peshawar were taken because natures of questionnaires were designed in such a way that every household can express views about asked questions on the basis of attributes. In the first part of analysis, related to descriptive analysis and last part of the study is related to quantitative analysis. In the first part of descriptive analysis 280 household responses will be broadcast through pie charts which will include output in-terms of percentage. Initial analysis will investigate about respondent willingness to pay for health insurance along with other attributes.
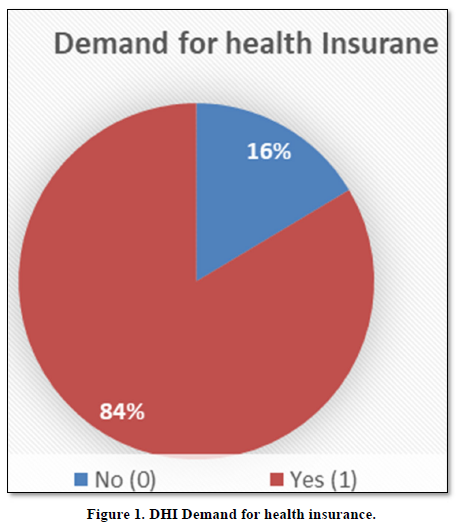
Demand for Health Insurance
Figure 1 Shows that, HH of 16% are not demanding HI, while 84% would like to have HI. The remaining 16% were not demanding for health insurance due to certain reasons, those reasons will be addressed in Figure 2.
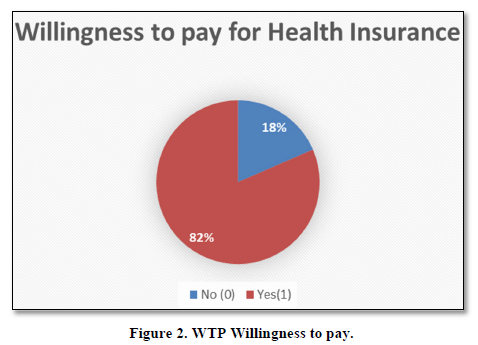
Willingness to pay
Above Figure 2 WTP, shows that individual household when asked to state their willingness. If current government demands you to pay certain amount of money per month, 18% negate such demand while 82% vote in favor of Yes.
Amount willing to pay for health insurance
Figure 3 shows that out of 82% who were willing to pay, 21% would like to pay PKR200, 32% opt for PKR300, 15% select PKR400, 27% would pay 500 and 21% state that they would like to pay PKR1000 per month.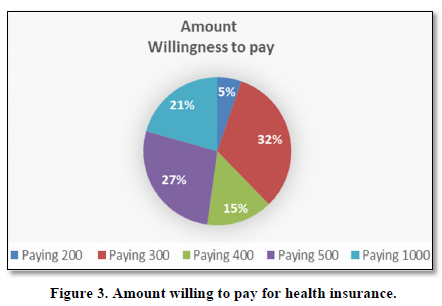
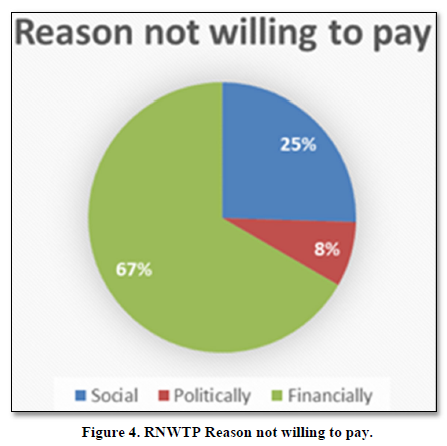
Reason not willing to pay for health insurance
From Figure 4 where 18% HH said that we are not willing to pay for HH, study investigates about reasons why HH are RNWTP for HI. HH of 25% said due to social constrains we are not been able pay for health insurance. HH of 8% said that poor performance by current government constrains my WTP, and poor financial position of 67% HH were not able to pay for health insurance.
Education level
Five categories were made for education level. Matric level HH were 42%, F.A/F.sc were 28%, B.A/B.sc were 5%, Diploma were 11% and 14% were those HH having higher education level (Figure 5).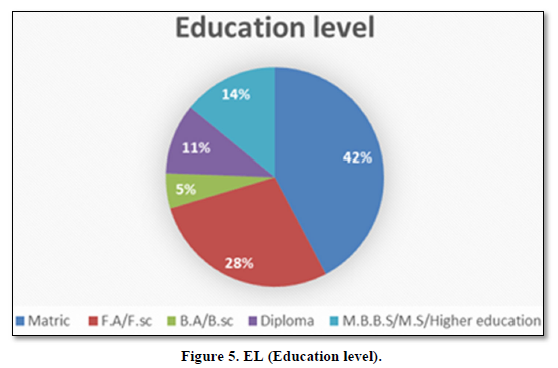
Marital Status
Out of 280 HH, single household were 26% and married were 74% (Figure 6).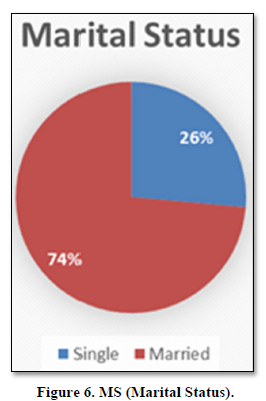
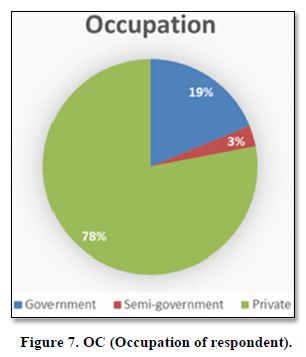
Occupation
Government employees were 19%, semi-government was 3% and those 78% were having their private business (Figure 7).
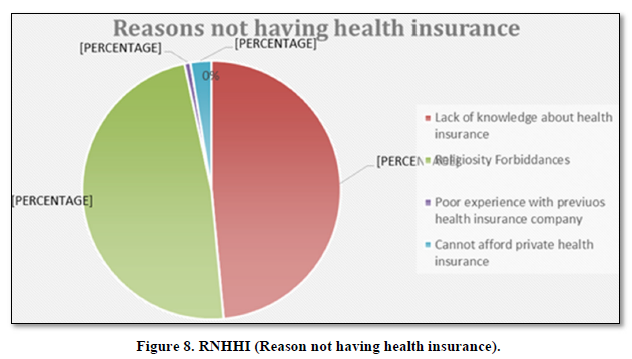
Reason for not having health insurance
HH of 280, both options, Lack of knowledge about health insurance and Religiosity Forbiddances gains 48% each. Poor experience with previous company was 1% while 3% HH cannot afford private health insurance (Figure 8).
Demand for Health Insurance
HH of 16% are not demanding HI, while 84% would like to have HI (Figure 9).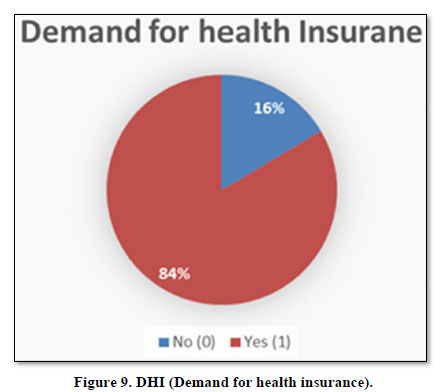
Reason not going for proper medical checkup
HH of 34% said that they are physically and mentally fit, 37% said that due to their weak financial position they fail to have medical checkup, 29% HH said due to lack of time we are unable to have medical checkup (Figure 10).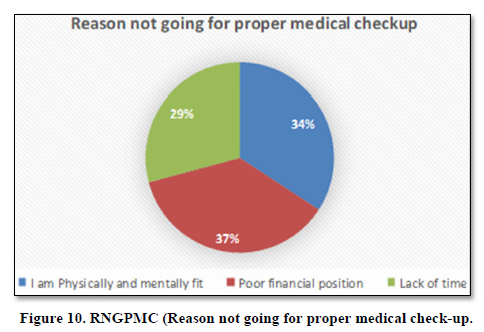
Medical checkup
HH of 16% said we take our family members for medical checkup every month, while on country note 84% said due to certain reasons we are not going for MC (Figure 11).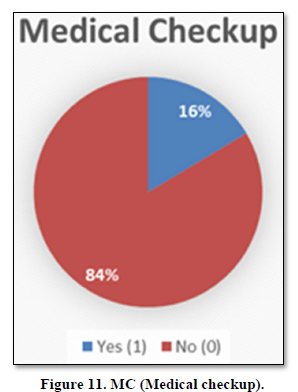
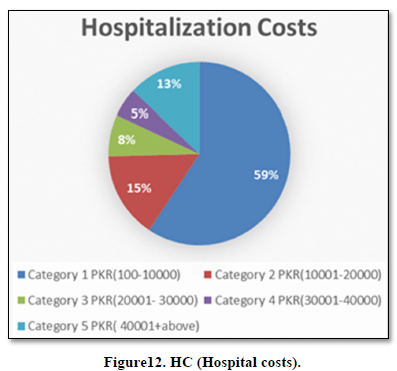
Hospitalization Costs
HH were investigating about their previous visit to hospital a month back. Five different costs categories were made. Category 1 HH whose costs interval lays between PKR (100-10000) were 59%, Category 2 HH were 15%, Category 3 were 8%, category 4 were 5% and category 5 were 13% (Figure 12).
Size of House
Above pie chart shows Size of House (SH), four categories were made, people whose house size was1-5 Marla were 40%, 6-10 Marla were 37%, 11-1 Canal were 17%, while 6% people lives more than 1 Canal (Figure 13).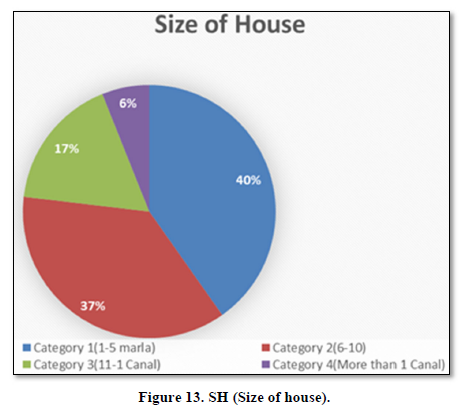
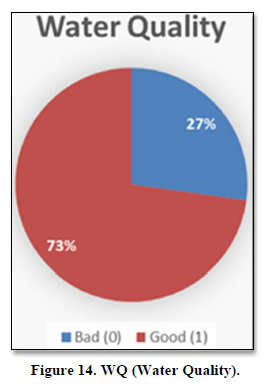
Water Quality
Two options were given to HH to state their WQ, 27% of HH were facing unhygienic water, while 73% said that they are blessed with neat and clean water (Figure 14).
Sanitation Management
Poor sanitation management (SM) 34% HH said that there is no proper SM in their areas. Due to which illness always stay for long time. While 66% people said that they are having no issue with SM (Figure 15).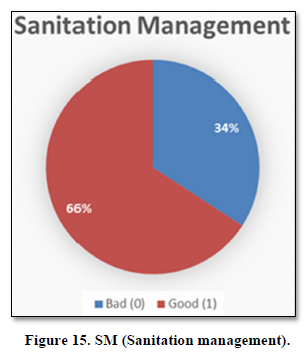
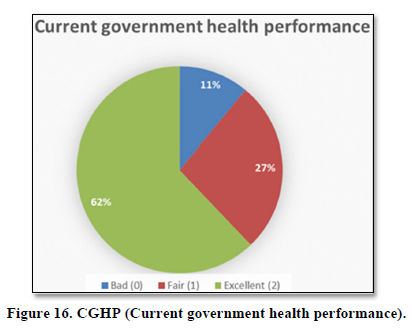
Current government health performance
HH of 11% said that they are not satisfied with current government health performance, 27% said that current government performance is better than previous government, while 62% said that current government health performance is excellent (Figure 16).
Summary
Variables which were not included in econometrics model were presented in descriptive form. Main interest area is people DHI and how much people from three areas are willing to pay for HI. Form is willing to pay for health insurance and is demanding for health insurance. Those who are not willing to pay are due to social constrains; political aspect can’t be eliminate (Table 3).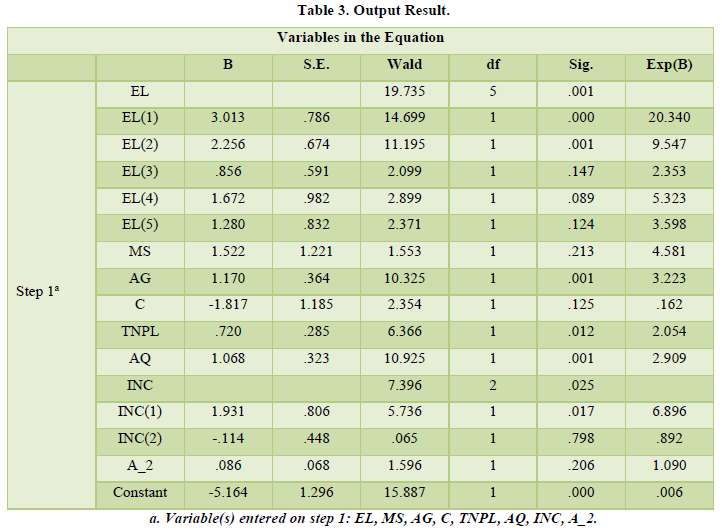
Empirical Findings and interpretation
Education level (EL) and income (INC) was taken in categorical form, while rest of variables due to their nature were not taken in categorical form. Over all EL is highly significant as its P-value is less than 0.05. If we look at EL (1) i.e. individual whose education level is Matric, 1 unit increase in Education level demand for health insurance increases by 3 units? By looking at Odds ratio of EL (1) which is greater than 1, means that odds of EL (1) are 20 times more likely to demand for health insurance. People of F.A/F.sc i.e. EL (2) is highly significant its p-value is less than 0.05, its co-efficient state that a unit increase in EL (2) demand for health insurance increase by 2.3 units, by looking at EL (2) odds ratios i.e. 9.54, people of EL (2) are 10 times more likely to DHI. Both EL (3) i.e. Diploma holder and EL (4) i.e. higher education (MBBS/M.Phil. /Ph.D.) are not significant because both are higher than P-value 0.05, but their odds ratios are quite significant for their DHI. In the following result EL (3) odds ratio is 2.3 means they are 2.3 times more likely to DHI. Same is the case with EL (4); they are 5.3 times more likely to DHI. Over all EL is significant for DHI, all odds ratios are going in favor of DHI. Second independent variable was M.S (Marital Status, two options were given if respondent was married then 1 was marked if single then 0 was marked). In the above table MS is not significant with DHI; by looking at P-value which is higher than 0.05, but looking at odds ratios DHI by MS are 4.5, which mean that success for DHI is 4.5 times higher. Third variable which was taken in current study was Age (AG in figure); P-value of AG is 0.001 means highly significant, co-efficient shows that unit increases in AG will 1.17 unit increases in DHI, as age increases by a unit demand for health insurance increases by 1.17 units. Odds ratios is 3.2, means that 3.2 times AG likely to have HI. Forth variable was Children (C, if respondent having children then 1 was marked otherwise 0). There is negative relationship exists between DHI and C. odds ratios for C is also go in favor of failure, 83.8% are failure chances held with C. Fifth variable was Total number of people living (TNPL). TNPL is significant along with odds ratios. A unit change in TNPL wills DHI .72 or 72%. Odds are 2.05 shows the TNPL will likely to have HI by 2.05 times. Sixth variable was Air Quality (AQ), co-efficient state that one unit improvement in air quality will demand HI by 1.06 units. As Air Quality improves demand for health insurances increases. Previous statement also validates point about odds ratios too, as odds for improvement in air quality will have success ratio of 2.9 times. Seventh variable consists of two category of Income, over all income variable is significant. INC (1) shows positive relationship with DHI, a percent increase in INC (1) will bring 1.93% DHI. Odds ratio state that 6.89 times INC (1) group will like to have DHI. While INC (2) shows negative relationship, as there income level increases they are less likely to have health insurance by 11%. Last IDV is Age Square. Age square is taken, to be see if age is double are they going to DHI, in current study though it show positive but in-significant relationship to DHI, but they are likely to DHI by 9%.
CONCLUSION
People from three areas of Peshawar, 84% individual household are demanding for health insurance. Those 82% are willing to pay for health insurance. Those who are not willing to pay for health insurance 67% IDHH are facing financial constraints. Expending education, awareness and improvement in environmental, social, political and demographic changes will leads to demand for health insurance in coming future. Those 18% who were not willing to pay were mostly those individual household who according to them lack of knowledge and religiosity forbiddances are the key issues not having health insurance. Only 16% used to have medical checkup once a year, while 84% are not going to have their medical checkup at near hospitals. Lack of health awareness is alarming situation. Hospitalization costs, where 39% IDHH visited last month ranges from PKR 10000-40000 or above. Such costs are not bearable for poor class family, because while conducting survey people complain about escalating power tariffs, and other utility costs make it impossible for us to have medical checkup. Good news about willingness to pay model is that 82% are willing to pay for health insurance. By taking KPK population, if 1 million people pays PKR350 per month 350 million can be received if such policy sustain KPK can have PKR4.2 Billion in their financial kitty, which can be spend on health as well as other financial sector. As a result employment rate increases, health status will be improved; life expectancy rate will be increased.
Several research directions can be taken from current study. How efficiently government can collect amount of money from household through willingness to pay. Exploring new Innovative and ease way to provide health services within received amount of money from household.
-
 Table 1
 -
Table 2


