Journal of Drug Design and Discovery Research (ISSN: 2640-6151)

Review Article
Development and Validation of RP-HPLC Method for Estimation Safinamide in its Bulk and Tablet Dosage Form.
11297
Views & Citations10297
Likes & Shares
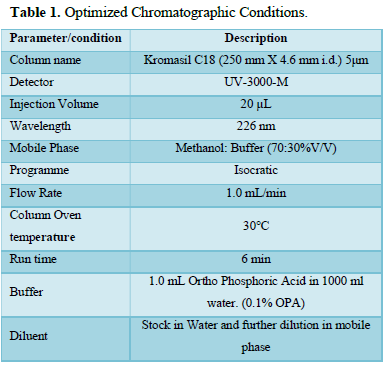
Background: A new, sensitive, suitable, clear, accurate, and robust reversed-phase high-performance liquid chromatography (RP-HPLC) method for the determination of safinamide in bulk drug and tablet formulation was developed and validated in this research. The separation was performed using an HPLC method with a UV detector and Openlab EZchrome workstation programme, as well as a Kromasil C18 (250 mm X 4.6 mm i.d.) 5μm. Methanol and buffer (70: 30%v/v) was pumped at a flow rate of 1.0 mL/min and detected at 226 nm.
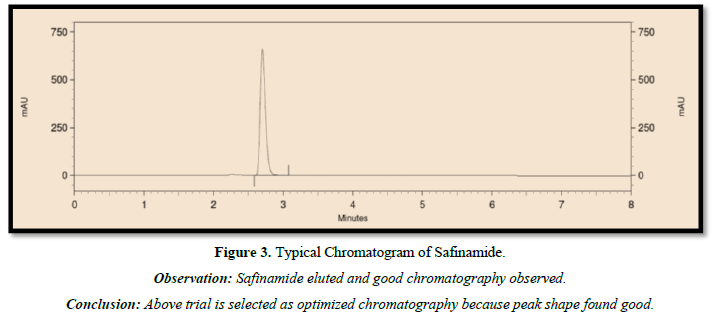
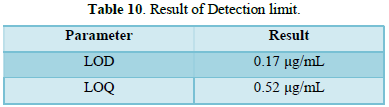
Result: The developed RP-HPLC method yielded a suitable retention time for safinamide of 2.57 min, which was optimized using trial and error basis. The linearity of the established method was verified with a correlation coefficient (r2) of 0.99996 over the concentration range of 1.01-15.14 g/mL. The percentage RSD for the method's precision was found to be less than 2.0 percent. The percentage recoveries were discovered to be between 99.60 and 100.80 %. 0.17 ug/mL and 0.52 ug/mL were found to be the LOD and LOQ, respectively.
Conclusion: The developed and validated RP-HPLC system takes less time and can be used in the industry for routine quality control/analysis of bulk drug and marketed safinamide products.
Keywords: RP-HPLC, Safinamide, Parkinson’s disease, Development, Validation
INTRODUCTION
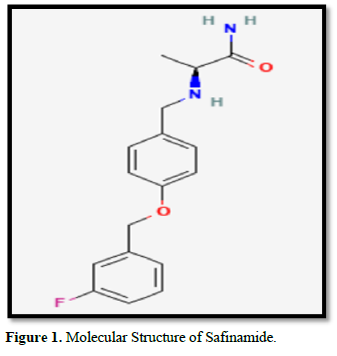
After Alzheimer’s disease, Parkinson’s disease (PD) is the second most common chronic progressive neurological condition among the elderly [1-4]. Newron developed Safinamide (Xadago) mesylate (SAF), an orally accessible derivative from the chemical class of amino amides with several modes of action, including inhibition of MAO-B and Dopamine reuptake, for the treatment of epilepsy and Parkinson’s disease [5-7]. In Europe, it was approved in February 2015, and in the United States, it was approved on March 21, 2017. Safinamide mesylate (SAF) (S1), also known as (S)-2-(4-((3-Fluorobenzyl) oxy) benzyl) amino) propanamide methane sulfonate, is a medication that was recently created to treat Parkinson’s disease (PD) [8].
METHODS
Materials and Reagents
Pharmaceuticals Ltd. donated safinamide as a gift sample (Figure 1) Qualigens (Thermo fisher scientific) provided HPLC grade methanol, acetonitrile, Ortho-phosphoric Acid (OPA), trifluoro acetic acid and analytical grade ammonium acetate. Moreshwar Enterprises provided HPLC grade water.
Instrumentation and software
An Agilent 1260 Infinity II HPLC system with DEAX02386 pump and autosampler with UV–visible detector served as the chromatographic system (DEACX16446). For data collection and processing, the chromatograms were registered using Openlab EZ Chrome Workstation on a Windows-based computer system. Safinamide concentrations were determined using a Kromasil C18 column (250 mm X 4.6 mm i.d. 5μm) column.
Ultraviolet (UV) spectroscopy
Safinamide mesylate stock solution: Weighed 13.2 mg of Safinamide mesylate (equivalent to 10 mg of Safinamide) and dissolved in 10 mL of water (1000 PPM of Safinamide).
Solution for UV Scan
- Safinamide solution: Pipette out 0.4 mL of Safinamide stock solution and diluted up to 20 mL with Water (20 PPM of Safinamide).
RP-HPLC method development
Preparation of standard stock solution
- Standard Preparation: Weighed accurately 13.2 mg of Safinamide mesylate (Equivalent to Safinamide 10 mg) and transferred to 20 mL volumetric flask. Added 15 mL of Water, sonicated to dissolve it completely, made the volume up to the mark with water. Further Diluted 1 mL to 50 mL with mobile phase (10 PPM of Safinamide).
- API sample preparation: Weighed accurately 13.2 mg of Safinamide mesylate (Equivalent to Safinamide 10 mg) and transferred to 20 mL volumetric flask. Added 15 mL of Water, sonicated to dissolve it completely, made the volume up to the mark with water. Further Diluted 1 mL to 50 mL with mobile phase (10 PPM of Safinamide).
- Tablet Sample Preparation for assay: Marketed Xadago 15 mg tablet formulation was available. Weighed the 20 tablets and calculated average weight of tablet. Weigh the powder material equivalent to 100 mg of Safinamide. Transfer it in a clean and dry 100 mL of volumetric flask, add 75 ml of water sonicate it for 15 min with intermittent shaking after every 5 min. Make the volume up to the mark with water. Filter the solution through suitable 0.45 µ syringe filter discarding 3-5 mL of filtrate. Further dilute 1 ml of filtrate to 100 ml with mobile phase (10 PPM of Safinamide).
Selection of analytical wavelength from the spectrophotometric method
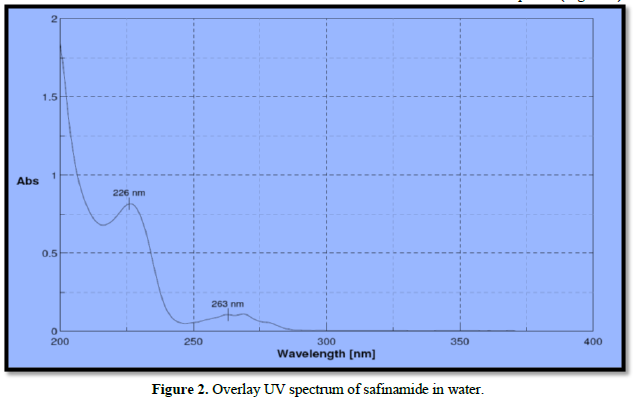
Analytical wavelength for the examination was selected from the wavelength of maximum absorption from the spectrophotometric analysis. The standard solution was scanned between 200-400 nm. The wavelength of maximum absorption was determined for drug safinamide is 226 nm which is used for further development (Figure 2).
METHOD VALIDATION
The developed method for simultaneous estimation of safinamide was validated for the following parameters using ICH Q2(R1) guidelines [9-21].
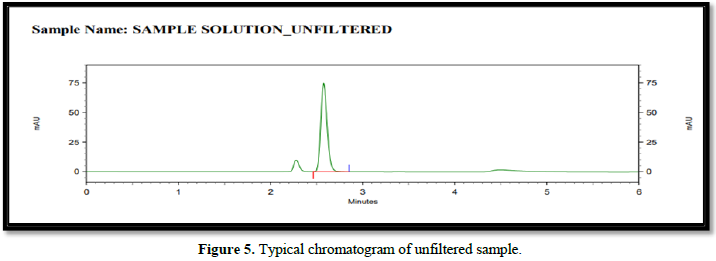
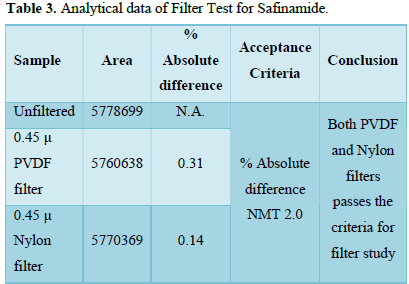
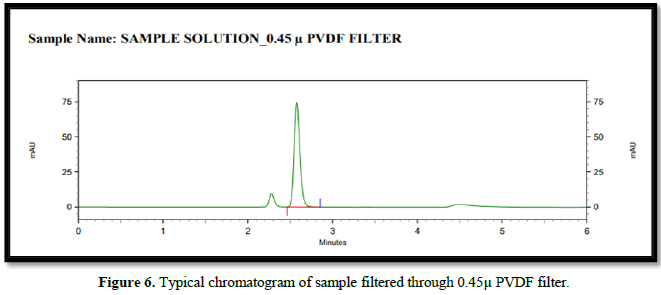
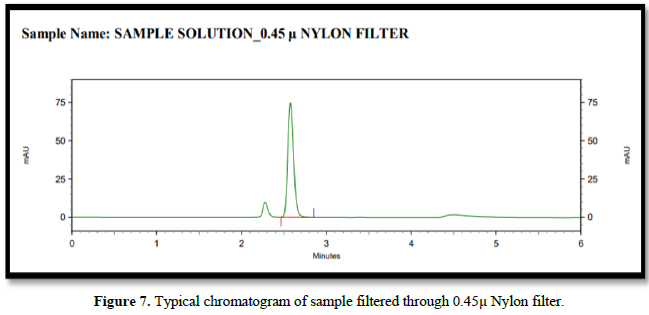
Filtration Study
Filtration experiment using centrifuged (unfiltered) sample and filtered test solution. During the filtration process, 5 mL of the aliquot sample was discarded and 0.45 m PVDF 0.45 and 0.45 m Nylon syringe filters were used.
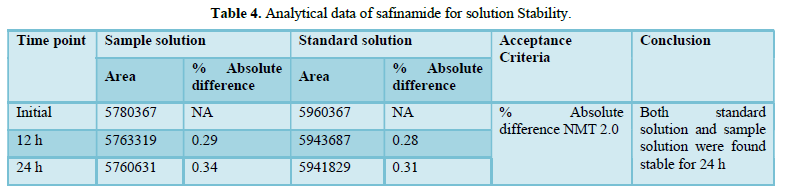
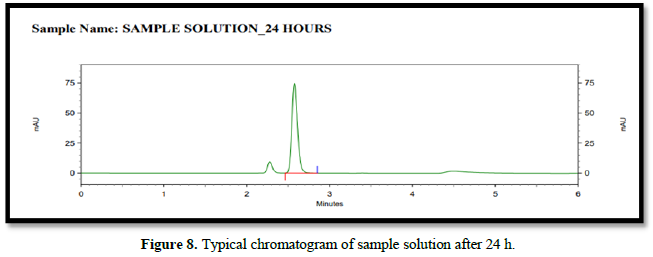
Stability of analytical solution
A stability analysis will be carried out on both the normal and test solutions. A test sample of tablet will be used to determine the stability of the test solution. The stability test will be carried out in a standard laboratory environment.
The solution will be held in a brightly lit laboratory for 12 to 24 h before being analyzed. The discrepancy between the test solution's results at each stability time point and the original will be calculated for the test solution stability analysis. The discrepancy between the effects of the stability time point and the original will be calculated in a standard solution stability analysis.
Specificity
To demonstrate the method's precision, the following solutions will be prepared and injected. (double-checked the peak purity).
- Blank, (diluent)
- Standard Solution
- Sample solution
- Placebo treatments
Linearity and range
The statistical treatment of test results obtained by examination of samples with analyte concentrations around the claimed spectrum determines the analytical method's linearity. As a function of analyte concentration, the region is graphically plotted. Curve fitting percentages are measured.
Accuracy (% recovery)
The accuracy will be tested in the range of 50% to 150 percent of the working concentration. Every occurs solution will be prepared in triplicate. A placebo will be included in the experiment. For each study, the percent recovery was determined.
Precision
- There are two levels of precision: repeatability and intermediate precision. It is carried out on a sample API.
- Repeatability (Intraday Precision)
- Intermediate precision (Interday precision)
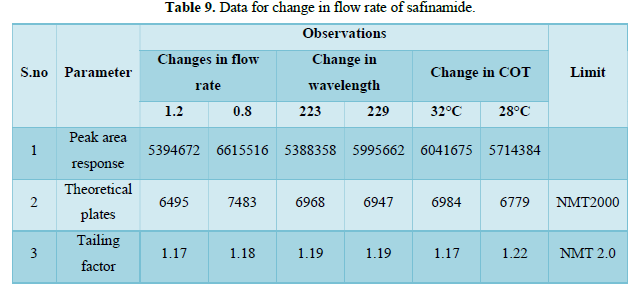
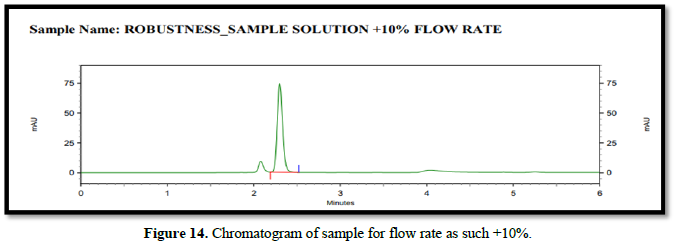
Robustness
Blank, the API test sample was prepared. These samples were injected under different chromatographic conditions as shown below.
- Changes in flow rate. (±10%)
Flow rate - 0.8 mL/min, 1.0 mL/min, 1.2 mL/min
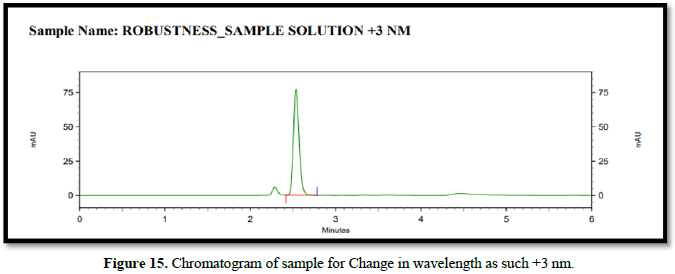
- Change in wavelength. (±3 nm)
Wavelength - 223 nm, 226 nm, 229 nm.
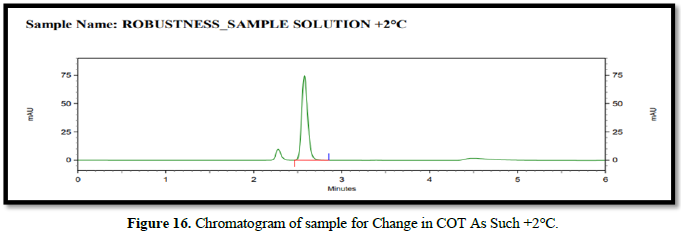
- Change in Column oven temperature: ±2°C
COT- 28°C, 30°C, 32°C.
Detection: The limit of detection (LOD) and limit of quantification (LOQ) were calculated separately using the following equations based on the standard deviation of the y-intercept and the slope of the calibration curve, respectively.
RESULTS
Optimization of mobile phase
Optimized Chromatographic Conditions
The following chromatographic conditions were established by trial and error and were kept constant throughout the method (Table 1, Figures 3 & 4).
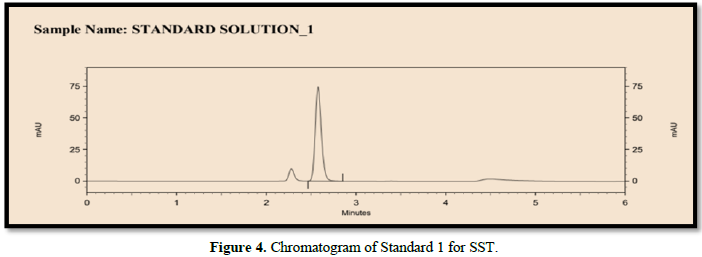
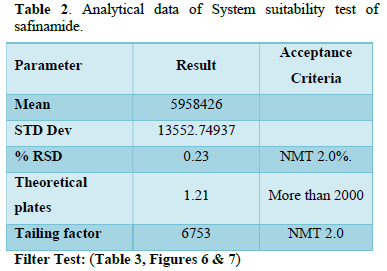
System suitability test (SST)
It was observed from the data tabulated above; the method complies with system suitability parameters. Hence, it can be concluded that the system suitability parameter meets the requirement of method validation. Typical chromatogram of SST for safinamide is shown in Figure 5. Analytical data of System suitability test are given in Table 2.
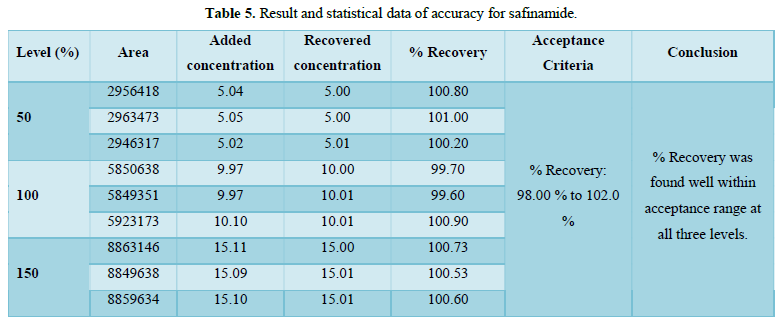
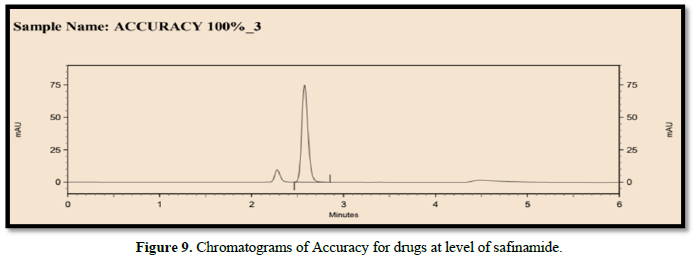
Accuracy(%Recovery):
- % Recovery was found well within acceptance range (98.00 % to 102.0 %) at all three levels. Result and statistical data of accuracy was given in Table 5 and Figure 9.
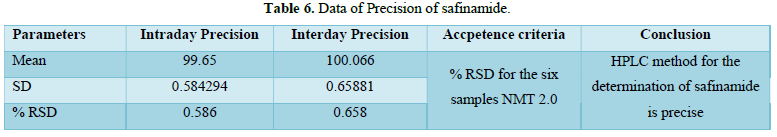
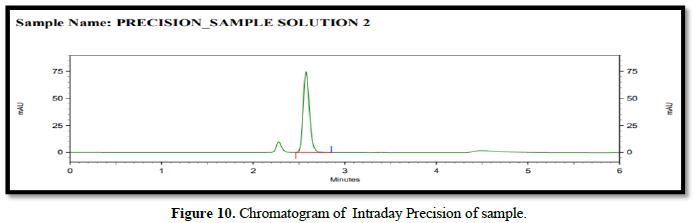
Precision:
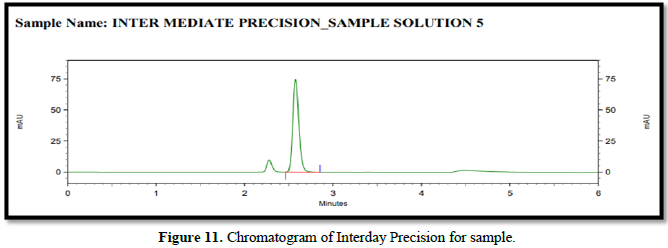
% RSD for 12 sample (Precision and Intermediate Precision samples) NMT 2.0 %. The %RSD of method precision is 0.586 & 0.658 Therefore, the HPLC method for the determination of safinamide is precise. Analytical data of both precision of safinamide is given in Table 6 and Figures 10 & 11.
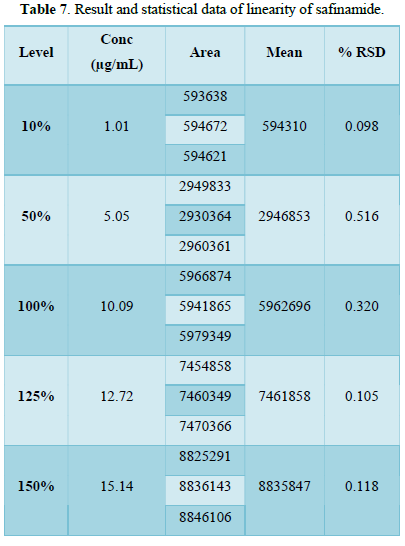
Linearity:
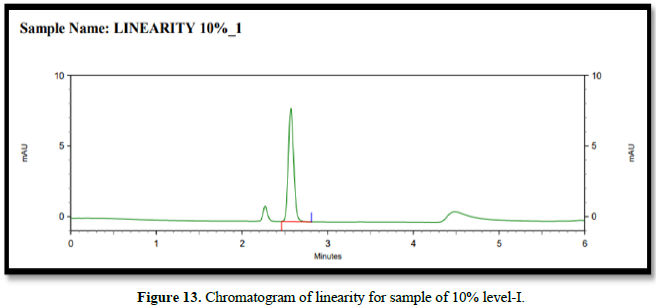
From the calibration curve we had to conclude that the safinamide shows linear response in the range of 1.0-15.14 μg/mL. The Regression value was found well within the limit. Result and statistical data of linearity of safinamide is given in table no. 13. Linearity graph of safinamide is shown in Figure 12 and Tables 7 & 8.
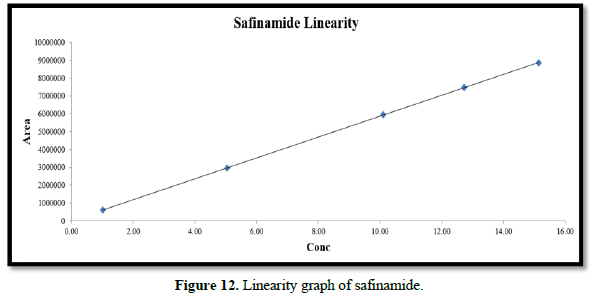
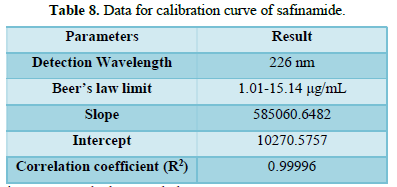
Conclusion: From the calibration curve we had to conclude that the safinamide shows linear response in the range of 1.01-15.14 μg/mL. The Regression value was found well within the limit.
Chromatogram of linearity for drugs (Figure 13)
Robustness:
Change in flow Rate (Tables 9 & 10)
Chromatogram for robustness (Figures 14-16)
Detection
It may be calculated based on the standard deviation (SD) of the response and slope of the curve(S). result of detection limit is given in Table 10. Calibration curve of safinamide for LOD and LOQ is given in Figure 12.
CONCLUSIONS
In the developed RP-HPLC method, the analyte was resolved by using an isocratic program, and the mobile phase was used Methanol: buffer (70:30 % v/v) at a flow rate of 1.0 mL/min, on an HPLC system containing UV- visible detector with Openlab EZ-Chrome Workstation and Kromasil C18 column (250 mm X 4.6 mm i.d. 5μm). The detection was carried out at 226 nm. The retention time for safinamide was found to be 2.57 min. The developed method has several advantages, including reproducibility of results, rapid analysis, simple sample preparation, and improved selectivity as well as sensitivity. The regression coefficient (r2) for each analyte is not less than 0.99996 which shows good linearity. The % recovery was in the acceptable range in the tablet dosage form. The % percent RSD was also less than 2.0 % showing a high degree of precision of the proposed method. Since the developed method is robust and reproducible and also less time consuming, it can be performed for routine analysis in the pharmaceutical industry for the bulk drug of safinamide and also in the pharmaceutical dosage form.
- Yadav HP, Li Y (2015) The development of treatment for Parkinson’s disease. Adv Parkinson's Dis 4(3): 59.
- Schapira AH (2011) Monoamine oxidase B inhibitors for the treatment of Parkinson's disease. CNS Drugs 25(12): 1061-1071.
- Blandini F, Armentero MT (2012) New pharmacological avenues for the treatment of L-DOPA-induced dyskinesias in Parkinson's disease: Targeting glutamate and adenosine receptors. Expert Opin Investig Drugs 21(2): 153-168.
- Onofrj M, Bonanni L, Thomas A (2008) An expert opinion on safinamide in Parkinson's disease. Expert Opin Investig Drugs 17(7): 1115-1125.
- Redasani VK, Mali BJ, Patil AS, Shirkhedkar AA (2013) Development and validation of RP-HPLC method for determination of safinamide mesylate in bulk and in tablet dosage form. Anal Chem Ind J 13(4): 127-130.
- Marzo A, Dal Bo, Monti NC, Crivelli F, Ismaili S, et al. (2004) Pharmacokinetics and pharmacodynamics of safinamide, a neuroprotectant with antiparkinsonian and anticonvulsant activity. Pharmacol Res 50(1): 77-85.
- Deeks ED (2015) Safinamide: First global approval. Drugs 75(6): 705-711.
- El-Kosasy AM, Hussein LA, Mohamed NM, Salama NN (2020) New and validated RP-HPLC Method for Quantification of Safinamide Mesylate in Presence of Its Basic Degradate, Levodopa and Ondansetron: Application to Human Plasma. JCS 58(9): 789-795.
- Malviya R, Bansal V, Pal OP, Sharma PK (2010) High performance liquid chromatography: A short review. J Global Pharma Technol 2(5): 22-26.
- Kazakevich YV, Lobrutto R (2007) HPLC for pharmaceutical scientists. John Wiley & Sons. Available online at: https://www.wiley.com/en-in/HPLC+for+Pharmaceutical+Scientists-p-9780471681625
- Laboratory Info (2020) High Performance Liquid Chromatography (HPLC): Principle, types, instrumentation and Applications. By editorial team on January 2020 in biochemistry, Laboratory info. Available online at: https://laboratoryinfo.com/hplc/
- Margaret E, Lacourse, William R, Course L (2017) “CHAPTER 17-General instrumentation in HPLC” University of Maryland, Baltimore County, MD, United States, Liquid Chromatography (Second Edition) Fundamentals and instrumentations, pp: 417-429.
- Sabir AM (2013) HPLC method development and validation -a review. IRJP 4(4): 39-46.
- Sangshetti JN, Deshpande M, Zaheer Z, Shinde DB, Arote R (2017) Quality by design approach: Regulatory need. AJCH 10: S3412-S3425.
- International Conference on Harmonization of technical requirements for registration of pharmaceuticals for human use ich harmonized tripartite guideline validation of analytical procedures: text and methodology Q2(R1) Validation. Available online at: https://www.ich.org/page/qualityguidelines\
- Pendbhaje NS, Jamdhade AA, Pathan SM, Nirmal RV (2021) A Review on Quantification of Brexpiprazole in Its Bulk and Pharmaceutical Dosage Form by Various Analytical Methods. IJPRA 6: 1118-1132.
- Vidushi Y, Meenakshi B (2017) A review on HPLC method development and validation. Res J Life Sci Bioinform Pharm Chem Sci 2(6): 178.
- Nilesh S, Pendhbaje, Rupali V, Nirmal, Ashwini A, et al. (2021) Method Development and Validation by HPLC: A Brief Review. JPS 12(1): 27-39.
- Mukthi T (2016) A Review on High Performance Liquid Chromatography (HPLC). JPA 5(2): 22-28.
- Kasture AV, Ramteke M (2006) Simultaneous UV-spectrophotometric method for the estimation of atenolol and amlodipine besylate in combined dosage form. Indian J Pahrm Sci 68(3): 394-396.
- Barman RK, Islam MA, Ahmed M, Islam R, Khan A, et al. (2017) Simultaneous high-performance liquid chromatographic determination of atenolol and amlodipine in pharmaceutical-dosage form. Pak J Pharm Sci 20(4): 274-279.
-
 Table 1
 -
Table 2
-
Table 3
-
Table 4
-
Table 5
-
Table 6
-
Table 7
-
Table 8
-
Table 9
-
Table 10


