Journal of Infectious Diseases and Research (ISSN: 2688-6537)

Review Article
Multi-Sensor Study of the Impact of Air Pollution on COVID-19
4310
Views & Citations3310
Likes & Shares
The COVID-19 pandemic caused an unprecedented response from the countries leading to a complete or partial shutdown of human activities. More focus is being paid to mitigate and control the sources of this deadly virus. The results obtained all over the globe indicate that there is no alternative to lockdown till a suitable effective vaccine is invented. In this context, extensive observations of pollutants (PM1, 2.5, 10), NO2, SO2, CO, O3, VOCs), meteorological parameters, airmass back- trajectories, and complementary observations of atmospheric extinction or aerosol optical depth (AOD) and black carbon (BC) concentration have been carried out using the Air Quality Monitoring system, Multi-Spectral Solar Radiometer, Polar Nephelometer and Aethalometer at Amity University Haryana (AUH), Gurugram, India during the COVID-19 and associated lock-down period. We found an interesting relationship between air pollution (variability) and COVID-19 characteristics in terms of its detectability, spatial spread and intensity. Surprisingly, besides a substantial improvement in air quality, the results exhibited a complex relationship, indicating an increase in Corona cases with less ambient pollution. This was attributed to (i) delay in testing of patients, (ii) intermittent relaxations in lockdown period, (iii) non-observance of strict social distancing, (iv) indoor pollution scenarios and (v) local meteorology. In addition, a multi-site (rural, urban and high- altitude) study of BC measurements and the synchronous biomass burning (BB) contribution to it during the lockdown period of 15 March - 30 May 2020 has been conducted. The results indicate surprisingly low BB contribution during pre-lockdown and high BB during lockdown, revealing a clue to explain the on-going virus spread and the resultant mortality, even after continuing the lockdown. The association between the aerosol extinction and microphysical properties with the COVID-19 scenario during the above period also found to support this relation. More details of the experiments conducted, and the results obtained are presented.
Keywords: COVID-19, Ambient and indoor pollution, Infectious disease, Social distancing, Lockdown, Aerosols scattering and absorption
INTRODUCTION
Despite its increased incidence in both genders over the last Coronavirus is not a completely new but a typical and pandemic infectious disease. It is well known and quite evident from the literature that similar problems exist way back from the beginning of twentieth century [1]. Primarily, it is a microbiological problem, involving quick animal-to-human and human-to-human transmission of pathogens in size [(bacteria (~1000 nm) and virus (~27400 nm)]. Severe Acute Respiratory Syndrome (SARS) Coronavirus (SARS-CoV) was the virus that caused the first major pandemic of the new millennium [2,3] explosive nature of the first SARS epidemic, the high mortality, its transient reemergence a year later and economic disruptions led to a rush on research of the epidemiological, clinical, pathological, immunological, virological and other basic scientific aspects of the virus and the disease [4]. The increase in our understanding of the virus and the disease within such a short time has alarmed the development of diagnostic tests, animal models, antivirals, vaccines and epidemiological and infection control measures [5-7]. Earlier studies reveal that horseshoe bats are the natural reservoir for SARS-CoV-like virus and civets are the amplification host [8]. The COVID-19 was first detected in China in late 2019 and thereafter, it spread in all its neighboring countries initially and all over the world finally.
The initial step needed for this search is identify and locate the source of this virus. The source may not be specific but a resultant of many processes finally affecting human body very seriously. In this context, the current scientific understanding, all over the world, is not much clear. Some studies suggest that COVID-19 is an airborne disease, and some others say that it is water-borne/soil-borne disease. However, all these transmission media are interlinked, and their interactions/feedbacks are highly important for the forecast modeling of this widespread rapid infectious disease. A review article, discussing about recent diagnostics and the potential use of certain Indian medicinal herbs for the effective treatment of COVID-19 has been published by Balachandar et al. [9]. A report, documenting the impact of air pollution on deaths, disease burden and life expectancy across different states of India has been published by Balakrishnan et al. [10]. Sandip et al. [11] have reported some modelling studies delineating the public health interaction strategies for mitigating the Coronavirus disease.
Several reports and research articles have been published soon after the detection of COVID-19, all over the world [12-14]. Very recently published report by Department of Immunology and Infectious Diseases, Harvard T-H Chan, School of Public Health, Harvard University state that air pollution levels and COVID-19 mortality rate are closely linked, and COVID-19 patients in regions with history of high pollution are more likely to succumb to the diseases than those in states with relatively better air quality [15]. Moreover, the long-term exposure to air pollution decreases the susceptibility to COVID-19, leading to respiratory illness. These studies also indicate that ‘an increase of only 1 micro-gram per cubic meter in PM2.5 is associated with a 15% increase in the COVID-19 death rate (https: // theprint.in/ health/air-pollution-levels-and-covid-19-mortality-rate-are-linked-claims-new-harvard study / 397648/). With regards to COVID-19, it is not yet clear that whether warmer temperature and social distance slow down the spread of coronavirus and climate change affect the transmission of COVID-19 [16].
MATERIALS AND METHODS
Motivation
Recent reports, including the NASA satellite imageries show that dampening fluctuations (negative variability) in concentrations of criteria atmospheric constituents have some plausible relationship with intensity/growth, spread and detectability of Coronavirus (https://www.theguardian.com/environment/2020/mar/23/coronavirus-pandemic-leading-to-huge-drop-in-air-pollution). This indirectly implies that reduction in NO2 pollution by cutting-down the emissions of nitrogen from major sources such as automobile and industrial sectors. These results, among others, prompted us to investigate such possible causes in one of the most polluted locations like Delhi NCR and neighboring regions. In this communication, we made attempt to examine the linkages between the physical-chemical-dynamical characteristics of air pollutants (primary and secondary) and morphology of the coronavirus (COVID-19) encompassing the Government’s recent decision of observing a Nationwide Janata Curfew on 22 March 2020, thereafter, continuing lockdown policy.
Study area
The principal experimental area is the campus of Amity University Haryana (AUH), situated in a village, called, Panchgaon (28.31oN, 76.90oE, 285 m above mean sea level), about 50 km away from Delhi. The environment in and around the study area is rural, enveloped by Aravalli hillocks of average elevation of about 200 m. Thus, the experimental site has complex topography with valley-like terrain. Moreover, the wind pattern induced by the surrounding orography often affects the pollution transport significantly. More details about the study region and its environment around can be found in Devara [17]. Added, data for the study period from some specific CPCB (Central Pollution Control Board) monitoring urban network stations, spread in the Delhi NCR (http://www.cpcbenvis.nic.in/index.html), are analyzed and compared with the features observed at AUH, a rural station but lies on its periphery.
Data and analysis
The experimental facilities that have been utilized in the present study include MAPAN-AQMS (Modelling of Air Pollution and Network-Air Quality Monitoring System), MICROTPS-II multi-wavelength Solar Radiometer, and Ecotech Model Aurora 4000 Polar Nephelometer. The continuous data of primary and secondary pollutants (total 16 parameters) together with 6 meteorological parameters, columnar aerosol optical depth (AOD), aerosol size index and atmospheric scattering coefficient, archived from 15 January to 23 March 2020 with the MAPAN system in the AUH campus, and from some prominent pollution sites of CPCB network shave been collected. The synchronous data from collocated solar radiometers and multi-spectral nephelometer have also been used, to characterize the environmental air quality in the present study. The instrument details and data analysis methods have been published elsewhere [17,18].
RESULTS AND DISCUSSION
Day-to-day variation in mean mass concentration of synchronous criteria pollutants and local meteorological parameters
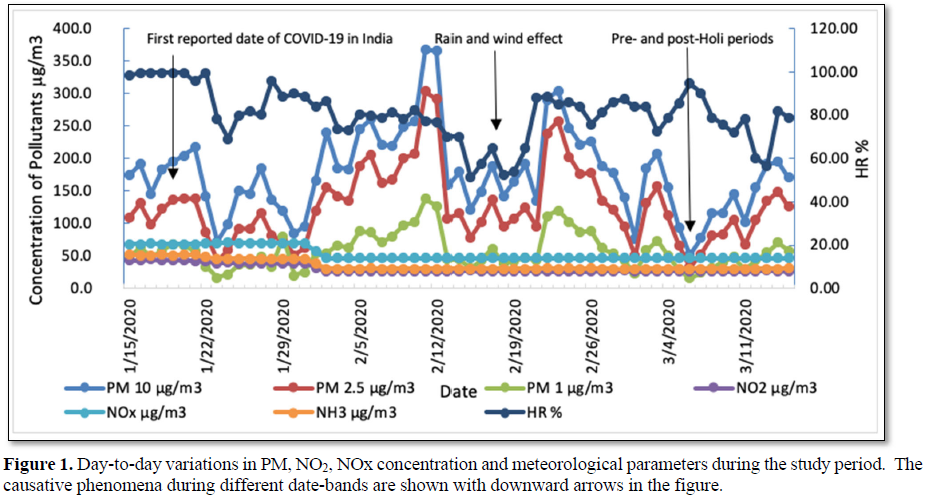
Figure 1 portrays the daily mean variation of PM1, 2.5, 10, NO2, NOX and relative humidity (HR), recorded, with the Air Quality Monitoring System (AQMS), established at Amity University Haryana (AUH), Gurugram, during 15 January – 15 March 2020. The salient undulations in the above parameters during different meteorological and festive (Holi, an Indian celebration) conditions can be noted. The processes responsible for the variations in criteria pollutants and meteorological parameters observed during different periods have been indicated in Figure 1.
Day-to-day marching of NO2 mass concentration variability
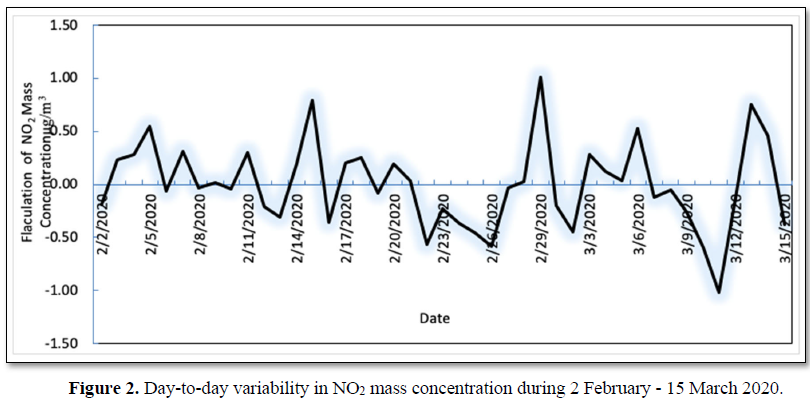
The day-to-day fluctuations in NO2 concentration are plotted in Figure 2 in terms of its variability (departures from mean) during the study period. It is clear from the figure that variability in NO2 mass concentration is larger on 15th, 29th February 11th March (negative) and 13th March 2020. Thus, the variability suggests that larger fluctuations during the first half as compared to the second half of the study period. From this, we can infer three possibilities, namely, detection, intensity (number of positive/negative cases), and spread of COVID-19. If we assume that the Coronavirus is growing/populating with time, larger variability (deviation from mean) in NO2 mass concentration appears to exhibit a relationship (correlation) with the increase in detectability or intensity or spread of Coronavirus.
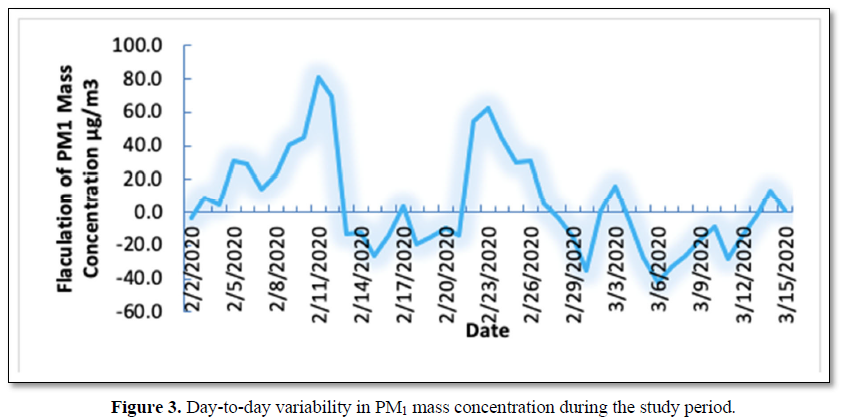
Daily mean variations in PM1 mass concentration
PM1 are the particulate matter of cut-off diameter up to 1 micron and they are also termed as ‘ultrafine particles’, mostly formed from the gas-to-particle-conversion (GPC) processes. These particles will have the potential for the largest deposition rates in the lungs. They can enter the body through the skin and rapidly pass through the blood circulation system and accumulate in the lungs, liver, bladder and many other organs. Moreover, compared to PM10 and PM2.5, PM1 plays a critical role in the transmission of viral diseases. Albeit, variability in PM10, 2.5 and 1 are studied, only the variability in PM1 concentration is discussed here. Moreover, particle size plays an important role in defining toxicity. Smaller the particle, more the mobility and toxicity.
Further, chances are high for these particles to form from gases through gas-to-particle conversion processes. By considering these aspects, the day-to-day variability in PM1 is plotted in Figure 3. It is very clear that the variability is larger positive in the initial period and declined (more negative) during the latter, revealing that the PM1 fluctuations are higher initially and decreasing gradually during the study period. This indirectly suggests that the pathogens (virus and/or bacteria), covering the nano-particle clusters present in PM1 mass concentration and associated dynamics can be partly responsible for the triggering and spread of virus.
More details about the relationship between fluctuations in the primary/secondary pollutants and Coronavirus characteristics can be better understood by extending similar analysis to other pollutants such as SO2, CO, NH3, C6H6 and C7H8, which have been briefly discussed below. After implementation of Janata Curfew and Lockdown, the mass concentrations of these pollutants are found to be very low, resulting larger departures. Therefore, it may also be noted here that, in normal meteorological conditions, variations in NO2, SO2 and CO exhibit an inverse relationship with those of Ozone. Such situations affect the earth-atmosphere radiation balance and thereby the climate significantly. By looking at the current situation, we may recognize that real picture about the sources (at least the hotspots) of Coronavirus can be known after strict implementation of the Government policy of closure of many educational institutions, automobile sectors, industries, construction/demolition activities up to April 2020 and beyond.
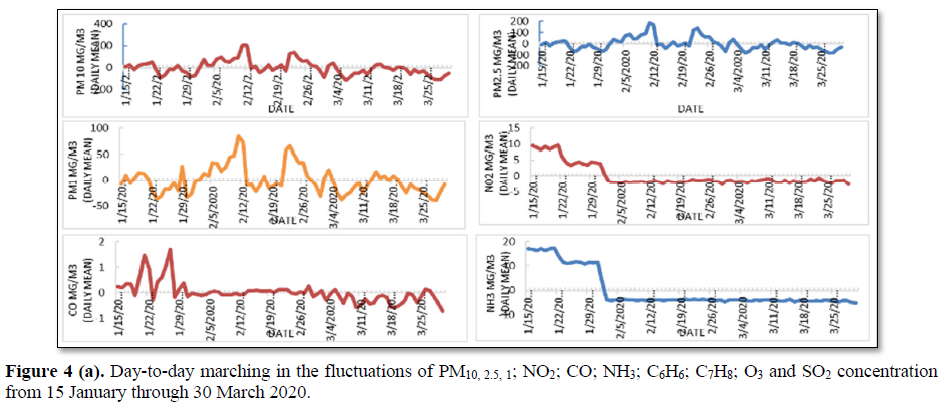
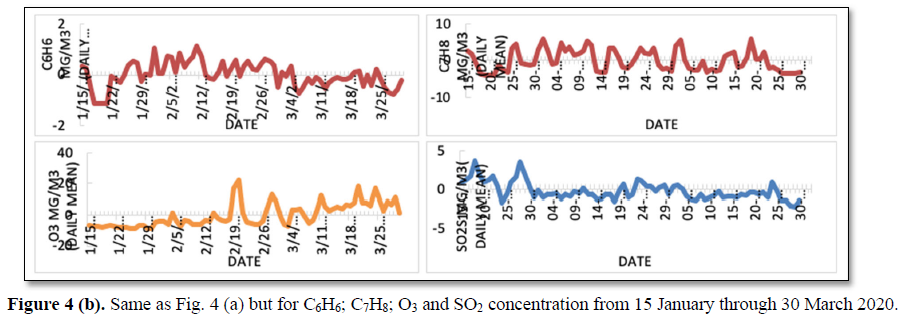
Daily mean variations in PM10, 2.5, 1, NO2, CO, NH3, O3, SO2, C6H6 and C7H8 Concentration departures during the extended period from 15 January through 30 March 2020
Figure 4 displays the day-to-day marching of criteria pollutant concentration during the study period. It can be seen very clear from all the frames that the fluctuations are larger, and departures are mostly positive in the first half while it is negative in the second half extended period between 15 January and 30 March 2020. It may also be recent one to be observed for nine minutes by every Indian citizen on Sunday (05 April 2020) night to light candles/oil lamps by completely switching off the electricity everywhere to weaken the Coronavirus (COVID-19) activity. This process indirectly reveals that it reduces the light pollution, particularly of the Germicidal UV-VI NIR region of the light spectrum, which plays a prominent role in biodefence countermeasures; even pulsed (femtosecond) high power lasers have been used to inactivate pathogens, as explained by Vatansever et al. [19].
Variations in surface meteorological parameters
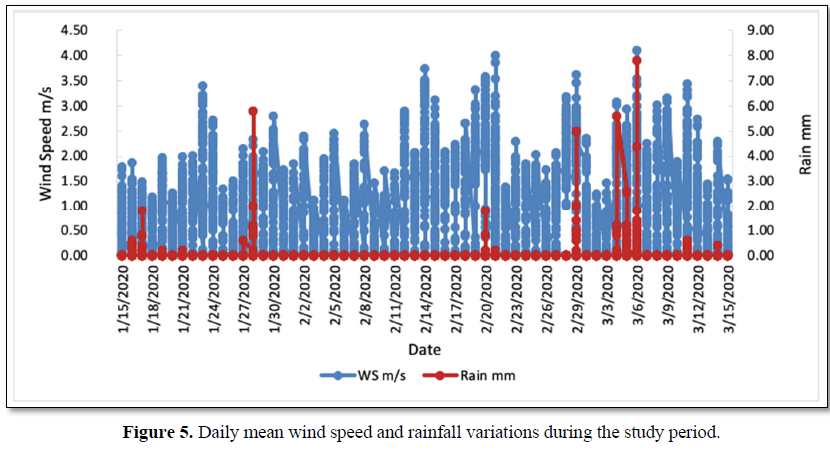
The synchronous surface meteorological parameters (wind speed and rainfall) observed with the AQMS are shown in Figure 5. Higher rainfall and stronger wind speed, observed on 28 January, 14 and 29 February and 4-5 March 29, 2020, higher rainfall and stronger wind speed cause reduction and dilution of pollutant concentrations, respectively. Significant reduction in PM and gas concentrations were also observed on those days (Figures 3 and 4). These reductions may have resulted in larger variability, relatively more variability was observed on subsequent days that led to larger variability in the absence of rain.
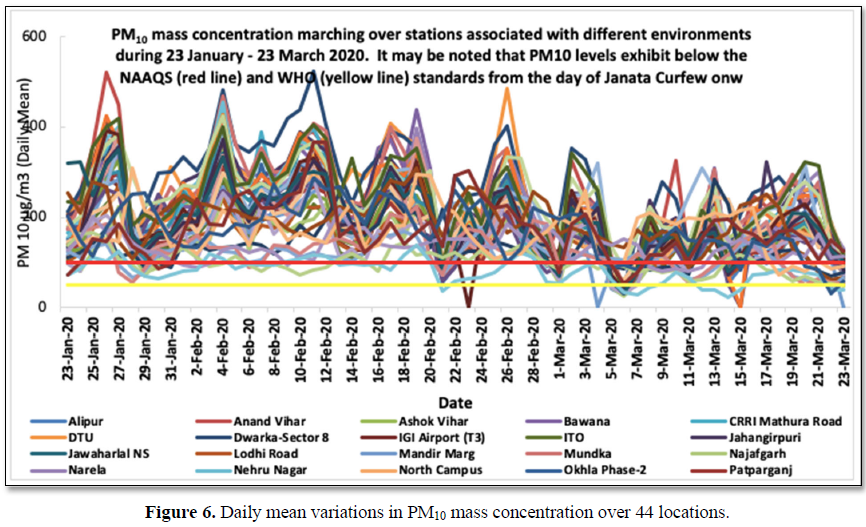
Time variation of fluctuations (variability) in PM10 measured over some locations in the Delhi NCR
The variability present in the mass concentration of PM10, observed over about 25 locations in and around the Delhi NCR during 23 January – 23 March 2020 are plotted in Figure 6. A few metropolitan stations are also potted in the figure for comparison purpose. The larger concentrations in the beginning have declined gradually with time. The linear trend line (black color solid line) also supports the same. Although this steep decrease in the daily mean values of PM2.5 could be due to the sudden occurrence of rain (more than 12 mm) and wind speed (nearly 3.5 m/s) between 29 Feb and 06 March, the trend continued further with more steep decrease (about 63 per cent) due to the Nationwide Janata Curfew observed everywhere in the country on 22 March 2020 and beyond due to lockdown throughout the Delhi NCR. These activities resulted in dramatic reduction in the levels of pollution and associated larger variability with negative departures in the criteria air pollutants (such as NO2, PM etc.).
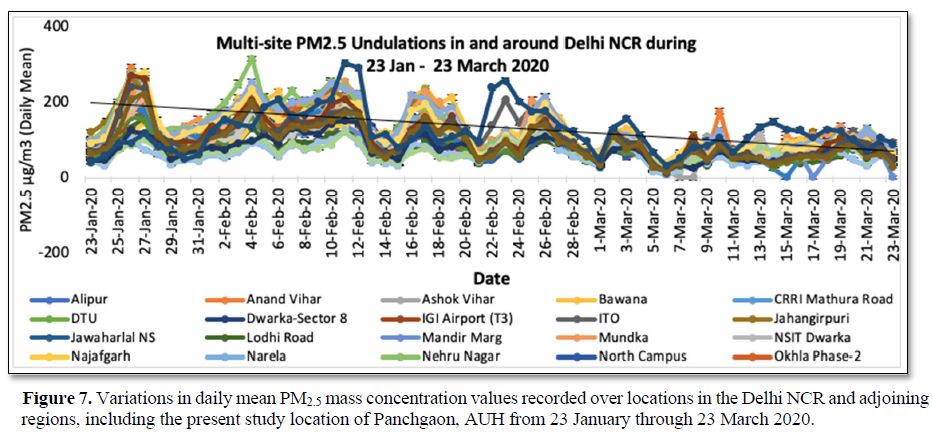
Multi-Site PM2.5 Undulations in and Around Delhi NCR
The day-to-day variations in PM2.5 mass concentration over hot-spot locations in the Delhi NCR and adjoining regions together with a few metropolitan stations in India (for comparison purpose) for the period from 23 January to 23 March 2020 are portrayed in Figure 7. The solid line in the figure denotes the linear trend line which reveals the decreasing trend of variations in the present case. Two highlights can be noted from this figure – (i) variations are similar to those observed in the other parameters discussed in the earlier sub-sections and (ii) mass concentrations are well below the NAAQS (National Ambient Air Quality Standard) and WHO (World Meteorological Organization) standards soon after the implementation of Janata Curfew and lockdown, announced by the Government of India (GOI) from 22 March onwards. The variations in NO2, SO2, CO, O3 and PM show in-phase with the spread of COVID-19 pandemic. Because the availability of test facilities was less initially, the impact of lowering of air pollution was felt slow, but it increased the PM2.5 mass concentration values recorded over locations in the Delhi NCR and adjoining regions from 23 January through 23 March 2020. (Such as the present study location of Panchgaon, AUH), the reductions are seen more prominent for PM1 and NO2 rather for other gaseous constituents such as SO2, NH3, O3 and VOCs. In other words, the departures for PM1 and NO2 exhibit more as compared to those of other criteria air pollutants. We have also studied the daily mean mass concentrations and their departures from mean during the continuing lockdown period from 23 March 2020 onwards. The results clearly showed an increasing trend in large negative gradients (departures) (figure not shown) in pollutant mass concentration and its association with COVID-19 intensity and spread. The prominent reduction in air pollution during the extended lockdown period up to May 03, 2020 and the post-COVID-19 period are being studied in the Delhi NCR and its adjoining regions to examine this association in more detail.
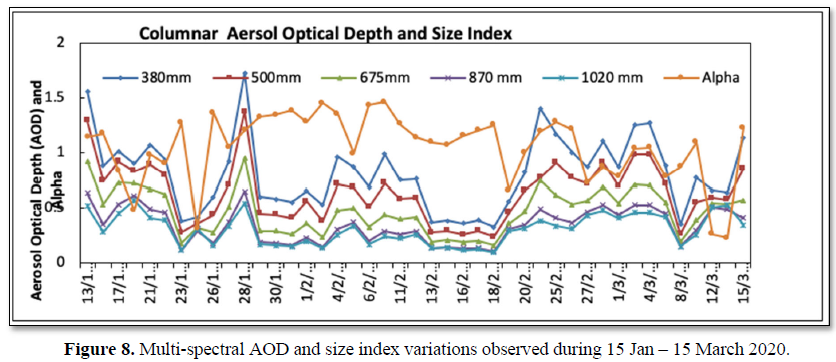
SOLAR RADIOMETRIC MEASUREMENTS OF AOD AND ALPHA
Columnar aerosol optical depth (AOD), which represents atmospheric extinction or attenuation (signature/proxy of particulate pollution load) and aerosol size index (ASI) or alpha, which gives rise to the integrated particulate size, both derived from the collocated multi-spectral solar radiometer have been plotted in Figure 8 for the period from 15 January to 15 March 2020. Higher alpha values denote abundance of smaller or ultra-fine particles and vice-versa. In other words, the lower alpha values represent large-size particles which we normally expect during the intense turbid periods such as haze, cloud etc. is consistent. The vertical bars at each data point indicates deviation from the mean. Normally, AOD increases with decrease in wavelength. This dependency changes depending on aerosol size distribution. This relationship is used to retrieve the aerosol size distribution. More details about the instrument employed, data archival procedure and method of data analysis can be found in Devara [20]. It may be noted from the figure that the columnar AOD varies with time like that of PM variations noted from the data recorded by the AQMS. The undulations in AOD and ASD, noted in the figure, can be attributed to the variations in wind speed and rainfall occasions during the study period. It indirectly means that the variations in ground-level PM variations coincide with those of Radiometer-recorded columnar AOD (atmospheric attenuation integrated between ground surface and up to stratospheric altitudes). AOD will be low during clear-sky conditions due to single-scattering phenomenon while it will be higher (multiple- scattering phenomenon) indicating the presence of turbid atmosphere i.e., hazy or cloudy or overcast sky.
The size index variations show larger (abundance of accumulation-mode particles) in the initial period and it changed to lower values (indicating the coarse-mode or bigger particles) in the later stages. This coincides with one of the contentions that COVID-19 confines to the levels near the ground, implying that larger portion of it contains Moreover, the size index follows increasing trend in the first half and decreasing trend in the later part of the study period. This smaller size index may turn to further smaller during the present lockdown period due to well-known reasons. This result gives rise to some clue to confirm that COVID-19 confines to near-the-ground air layer whether its transmission is through the lower and upper levels of the atmosphere. Confirmation of this fact depends on the sky conditions.
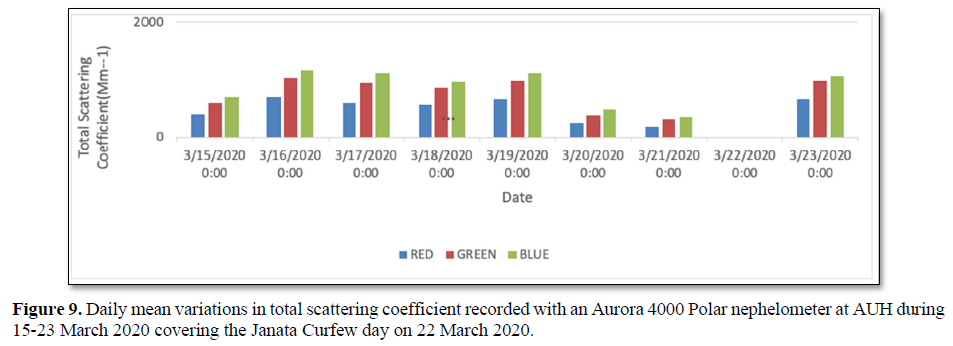
NEPHELOMETER MEASUREMENTS OF ATMOSPHERIC EXTINCTION
A polar wavelength-integrating nephelometer of Ecotech-make Aurora 4000 has also been operated simultaneous to the AQMS and solar radiometer. The nephelometer measures light scattering by airborne particles in the atmosphere, containing particulate matter (scattering) and gaseous constituents (absorption). The main parameter that the instrument measures is the extinction coefficient as a function of wavelength. In this instrument, the wavelength-integrating atmospheric extinction at three sensing wavelengths of 450 nm (blue), 525 nm (green) and 635 nm (red) is measured. The instrument details and method of analysis of data have in discussed elsewhere [21,22]. In normal atmospheric conditions i.e., in clear-sky, clam wind conditions, the atmospheric extinction will be higher at smaller wavelengths since they are more sensitive to fine-mode particles. The spectral-time variations in the total (forward plus backward) scattering coefficient at the three probing wavelengths are plotted in Figure 9. Thus, this instrument provides indirectly the air pollution at any location in terms of scattering coefficient and visibility.
It is very interesting to note here that the scattering coefficient is larger in the initial period and it diminished in the later part of the March month, the period from which more alertness was cautioned to the public by the Government as the victims’ cases started blowing-up. The instrument could not record any data on the Janata Curfew day (22 March 2020). This could be due to the sensitivity of the instrument. In other words, the levels of both primary and secondary particle density are so low that they could not trigger the sensor (i.e., below the thresh-hold level). On the next day i. e. on 23 March, the coefficient value has gone up due to partly cloudy sky conditions. On the following day onwards, the scattering coefficient continued showing very low values. This shows a clear-cut evidence to the switching off the three major anthropogenic reservoirs, namely, automobile, industrial and construction sectors which heavily, otherwise, pollute the environment. This inference, once again, warrants that scrubbing of air pollution helps reducing the intensity (in terms of victim density) or spreading (spatial coverage) or detectability of COVID-19. These results indirectly suggest that reduction of air pollution (by lockdown process or any other alternative) promises a major relief from the on-going deadly Coronavirus.
POLLUTION STUDIES DURING LOCK DOWN PHASES DUE TO COVID-19
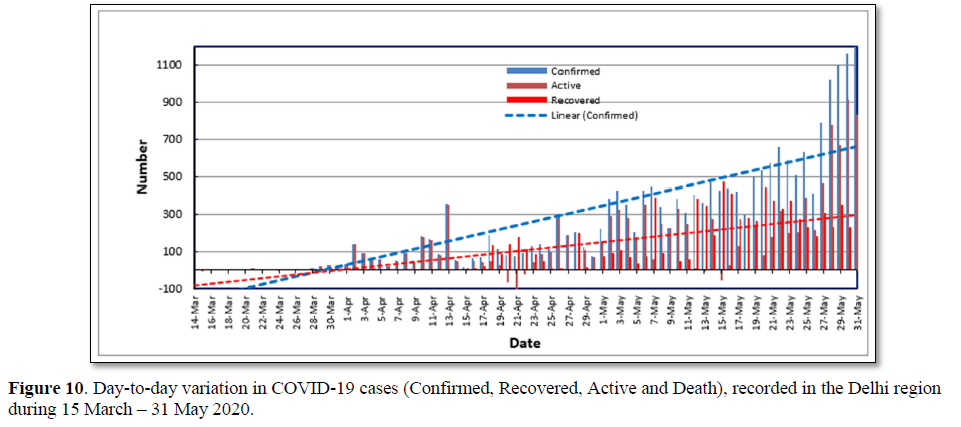
The concurrent measurements of criteria pollutants, performed by employing an AUH-IITM joint experimental facility, and synchronous data from CPCB archive in and around Delhi NCR, have been used to examine the influence of air pollution on the Coronavirus (COVID-19). In order to arrest the spread of this infectious disease, Government had introduced lockdown in a phased manner and strict social distancing. So far, very limited studies in India have been available in the literature relating to the effects of lockdown due to the COVID-19 on air quality over Delhi [23, 24]. We have continued the above measurements to assess the impact of lockdown on air pollution vis-à-vis COVID-19 spread. One side, the results showed a dramatic reduction (more than 65%) but on the other side, the results exhibited a complex relationship, indicating less ambient pollution results in increase of Coronavirus cases. The day-to-day variation in Coronavirus around the lockdown period is portrayed in Figure 10. The figure clearly shows an increasing trend in ‘confirmed’ and ‘recovered’ cases while the ‘active’ cases swing between positive and negative values with gradual reduction from postulated to be due to (i) delay in testing of patients, (ii) intermittent relaxations in different phases of lockdown, (iii) non-observance of strict social distancing (iv) indoor pollution scenarios and (v) changes in local meteorology. However, the efforts put by the entire world, in the collective fight against Coronavirus, through lockdown, have led to an unprecedented improvement not only in human health but also in the global climate change scenario. Moreover, the surface ozone showed monotonic increase (figure not shown here) due to availability of more sunlight [25]. Figure 11a, b and c depict the BC concentration and associated BB contribution during 15 March – 31 May 2020, covering pre- and during lockdown period. It may be noted that the concentration at all the three sites showed higher during the pre-lockdown and subsequently they declined but with large fluctuations especially at Bhopal (urban) and Panchgaon (rural) sites, due to variations in local meteorology during this lockdown period (absence of anthropogenic activities). The BC concentrations are seen lower at Mahabaleshwar as compared to those over the rural and urban sites. The significant feature that can be noted here is that the BB contributions are significant at all the three sites. More interestingly, the BB contribution was noticed to be considerably higher at Mahabaleshwar (high-altitude). This Black Carbon (BC) measurements at this location show decrease while the biomass burning (fossil fuel, domestic cooking etc.) contribution to the total BC concentration shows increase during the lock-down period. In order to examine this aspect in relation to different sites (associated with different environments), simultaneous BC and BB measurements have been carried over two more sites, namely Bhopal (urban) and Mahabaleshwar (high-altitude). This feature supports the work reported by Saha and Chauhan [26], and indirectly suggests that the aspect of indoor pollution also could be responsible for the strength and spread of COVID-19, besides delay in testing procedure of patients and social distancing aspect [22,27,28].
Air pollution remains one of the major threats to human health and wellbeing everywhere, especially in cities. Due to the COVID-19 pandemic, human activities are largely restricted (Lockdown, LD) in many regions over the globe and more so in India since 25th March 2020. The Government of India (GOI) has implemented these restrictions in a phased manner (1 Phase: 25 March – 14 April; 2 Phase: 15 April – 3 May; 3 Phase: 4 – 17 May and 4 Phase: 18 - 31 May 2020). The records of PM1, 2.5 and 10, archived with the AQMS at AUH and about 36 CPCB stations in the Delhi region have been analyzed and variations in the PM levels during different phases of Lock Down (LDP) have been investigated. Interestingly, apart from a dramatic reduction in air pollution by either touching or remaining within the NAQQS and WHO’s, more than 50% reduction in LDP 1 and 2 as compared to LDP3 and 4, being LDP1 showed the minimum while LDP4 exhibited maximum during the total LD period. The main reason for these conspicuous changes is two-fold, one is meteorology (both local and long-range transport) and the other is relaxations provided to the public in between the LDs. Nevertheless, such reductions are expected to be purely temporary because the levels are likely to go up again once the situation gets back to normal life activity after the unlocking phase 1 (ULDP1). The effectiveness and cost are always top factors for policymakers to decide control measures.
CONCLUSIONS AND PERSPECTIVE
The collocated, synchronous measurements of atmospheric particulate matter and gaseous constituents carried out at AUH, Panchgaon-Manesar-Gurugram, and also the data collected from the CPCB archive for more than 44 locations in and around the Delhi NCR, have been used to investigate the influence of air pollution on the Coronavirus (COVID-19). Larger fluctuations or variability or departures in criteria pollutants (NO2, NH3, SO2, CO, O3 and PM) mass concentrations, and in the synchronous meteorological parameters, reveal a possibility for investigating an indirect relationship with the intensity/spread/detectability of the COVID-19 pandemic. The on-going Government actions like Janata curfew and long-period lockdown helped to deactivate or kill the virus/bacteria or reduce further spread of Coronavirus. As a result, the air quality has improved in the entire country, especially in Delhi, and levels are reduced even below the NAAQS (National Ambient Air Quality Standards) and WHO-prescribed limits. Thus, the efforts put by the entire world, in the collective fight against Coronavirus (COVID-19), have led to an unprecedented improvement not only in human-health but also the global climate change scenario.
The complex relationship observed between reduction in air pollution and increase in Coronavirus cases in the study area indicates presently three possibilities, namely, delay in virus testing, non-observance of social distancing and indoor pollution including the enhancement in radioactive emissions like Radon, Thoron etc. Additional finding of increase in surface ozone (bad ozone that effects health, crops etc.) possibly due to increase in solar light reaching the ground due to suppression of pollution. The current local exercises, going on in every country, involve identifying the hotspots and isolating them from the rest. Thus, this study, one way provides, the assessment of air quality in Delhi prior to and during lockdown implemented to provide social distancing required due to the COVID-19 pandemic. It also indirectly suggests the regulatory bodies that a significant improvement in air quality in India could be expected if strict execution of air quality control plans is implemented.
ACKNOWLEDGEMENTS
This research was jointly supported by the Amity University Haryana (AUH), Gurugram, India, and the Indian Institute of Tropical Meteorology (IITM), Pune, India. The authors express their sincere gratitude to Founder President, Chancellor and all other authorities of Amity University Haryana (AUH), Gurugram, India for continuous encouragement and support. Thanks, are also due to Ecotech Pty Ltd., Australia and IITM-HQ, IITM- DU, CPCB, New Delhi, India.
-
Hick JL, Biddinger PD (2020) Novel Coronavirus and old lessons – Preparing the Health System for the pandemic. N Engl J Med.
-
Drosten C, Gunther S, Preiser W, van der Werf S, Brodt HR, et al. (2003) Identification of a novel coronavirus in patients with severe acute respiratory syndrome. N Engl J Med 348: 1967-1976.
-
Muhammad AS, Suliman K, Abeer K, Nadia B, Rabeena S (2020) COVID-19 infection: Origin, transmission and characteristics of human coronaviruses. J Adv Res 24: 91-98.
-
Vieth H, Klenk D, Osterhaus AD, Schmitz H, Doerr HW (2003). Identification of a novel coronavirus in patients with severe acute respiratory syndrome. N Engl J Med 348: 1967-1976.
-
Poon LL, Wong OK, Chan KH, Luk W, Yuen KY, Peiris JS, Guan Y (2003) Rapid diagnosis of a coronavirus associated with severe acute respiratory syndrome (SARS). Clin Chem 49: 953-955.
-
Liane YKN, Robrigo CU (2020). COVID-19 pandemic: Impacts on the air quality during the partial lockdown in Sao Paulo State, Brazil. Sci Total Environ 730: 139087.
-
Liu J, Cao R, Xu M, Wang X, Zhang H, et al. (2020) Hydroxychloroquine, a less toxic derivative of chloroquine, is effective in inhibiting SARS-CoV-2 infection in vitro”, Cell Discovery 6: 16.
-
Webster RG (2004) Wet makers – a continuing source of severe acute respiratory syndrome and influenza?” Lancet 363: 234-236.
-
Balachandar V, Kaavya J, Mahalakshmi I, Arul N, Vivekanandan, G, et al. (2020). COVID-19: A promising cure for the global panic. Sci Total Environ 725: 1382277.
-
Balakrishnan K, Sagnik D, Tarun G, and Co-authors (2019) The impact of air pollution on deaths, disease burden and life expectancy across the states of India: The Global Burden of Disease Study 2017. Lancet Planet Earth 3(1): e26-e39.
-
Sandip M, Tarun B, Nimalan A, Anup A, Chowdhury A, et al. (2020) Prudent public health intervention strategies to control the coronavirus disease 2019 transmissions in India: A mathematical model-based approach. Ind J Med Res.
-
World Health Organization (WHO) (2019) Coronavirus disease 2019 (COVID-19), Situation Report, 67. Available online at: WHO-2020-apps who int.
-
Neeltji, van Doremalen, Bushmarker T, Morris DH (2020) Aerosol and surface stability of SARS-CoV-2 as compared with SARS-CoV-1. N Engl J Med.
-
Xu Z, Shi L, Wang Y, Zhang J, Huang l (2020) Pathological findings of COVID-19 associated with acute respiratory diseases syndrome. Lancet Respirat Med 8: 420-422.
-
Rachel CN, Benjamin MS, Danielle B, Francesca D (2020) Exposure to air pollution and COVID-19 mortality in the United States.
-
Heymann DL, Shindo N (2020) WHO Scientific and Technical Advisory Group for Infectious Hazards. COVID-19: What is next for public health? Lancet 395: 542-545.
-
Devara PCS (2017) Remote Sensing for Environment and Climate Diagnostics, Book Chapter, In: Environmental Science and Engineering, Studium Press LLC, USA, pp: 287-312.
-
Devara PCS, Maheskumar RS, Raj PE, Dani KK, Sonbawne SM (2001) Some features of columnar aerosol optical depth, ozone and precipitable water content observed over land during the INDOEX-IFP1999. Meteorologische Zeitschrift, 10: 23-130.
-
Vatansever F, Ferraresi C, victor pires de Sousa M, Yin R, Rineh A, Sharma SK, Hamblin MR (2013) Can bio-warfare agents be defeated with light?” Virulence.
-
Devara PCS (2018) Climate Change and Air Quality.
-
Devara PCS, Nicholas DS, Grant K, Logan D (2019) Polar nephelometer exploration of air quality over a rural station in North India, Proc. CASANZ-19, New Zealand, 16-18 September 2019.
-
Devara PCS, Vijayakumar K, Safai PD (2020a). Multi-spectral nephelometer characterization of urban aerosols. Measurement 154: 107471.
-
Susanta M, Pal S, Gopal G. (2020) Effect of lockdown amid COVID-19 pandemic on air quality of the megacity Delhi, India. Sci Total Environ 730: 139036.
-
Shubham S, Zhang M, Anshika Gao J, Zhang S, Kota SH (2020) Effect of restricted emissions during COVID-19 on air quality in India. Sci Total Environ 728: 138875.
-
Sicard P, Marco AD, Feng EAZ, Xu X, Paolett E, et al. (2020) Amplified ozone pollution in cities during the COVID-19 lockdown. Sci Total Environ 15: 139542.
-
Saha J, Chauhan P (2020) Indoor air pollution (IAP) and pre-existing morbidities among under-5 children in India: Are risk factors of coronavirus disease (COVID-19)? Environ Pollut.
-
Devara PCS, Kumar A, Sharma PB, Banerjee P, Khan AA, et al. (2020b) Influence of Air Pollution on Coronavirus (COVID-19): Some Evidences from Studies at AUH, Gurugram, India, Open Research Communication in the Social Science Research Network (SSRN), USA.
-
Roxana AAZ, Dan MS, Tautan N (2020) Assessing the relationship between surface levels of PM2.5 and PM10 particulate matter impact on COVID-19 in Milan, Italy. Sci Total Environ 738: 139825.


QUICK LINKS
- SUBMIT MANUSCRIPT
- RECOMMEND THE JOURNAL
-
SUBSCRIBE FOR ALERTS
RELATED JOURNALS
- Advance Research on Endocrinology and Metabolism (ISSN: 2689-8209)
- Journal of Psychiatry and Psychology Research (ISSN:2640-6136)
- Advance Research on Alzheimers and Parkinsons Disease
- Journal of Oral Health and Dentistry (ISSN: 2638-499X)
- Journal of Ageing and Restorative Medicine (ISSN:2637-7403)
- Journal of Rheumatology Research (ISSN:2641-6999)
- Journal of Neurosurgery Imaging and Techniques (ISSN:2473-1943)


