International Journal of Clinical Case Studies and Reports (ISSN:2641-5771)

Research Article
Detailed Lifestyle Comparison Study Between Pre-COVID-19 and COVID-19 Periods Using GH-Method: Math-Physical Medicine (No. 322)
3674
Views & Citations2674
Likes & Shares
The author utilizes big data based on lifestyle details to quantitatively compare the differences between two periods: pre-COVID-19, from 5/5/2018 to 1/18/2020, and COVID-19, from 1/19/2020 to8/29/2020.
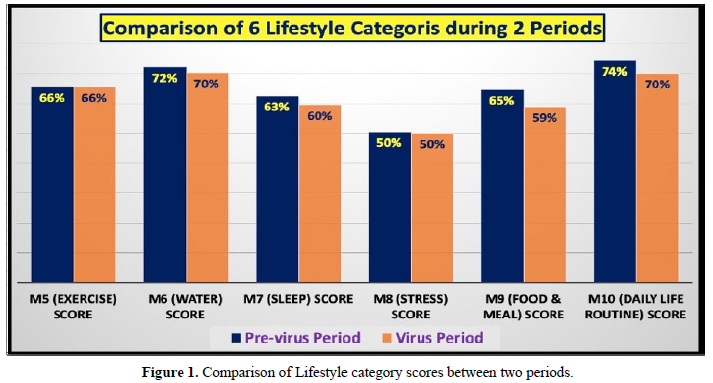
The “Comparison of 6 lifestyle categories during 2 periods” is the most important and conclusive chart because it shows the direct comparison of lifestyle category scores using bar charts. The first observation is that all scores are below the break-even line of 73.5% which means healthy lifestyle has been maintained during these two periods. The second observation is that, while exercise and stress categories have the same scores, all of the other four lifestyle categories (water intake, sleep, food/meal, and daily life routine) have lower scores during COVID-19 compared to the scores of pre-COVID-19.
The COVID-19 virus is the worst epidemic in recent human history in terms of its spreading speed, fatality number, and emotional impact on the world population. People belonging to the “vulnerable” groups, such as the elderly with medical history or existing chronic diseases and complications, require special consideration to their health conditions as well as lifestyle management program during this period. However, the author, who is 73-year-old, achieved even better results on his diabetes conditions and overall health control in terms of weight, blood pressure, glucose, and HbA1C values. The knowledge and experience he acquired in the past 10 years of medical research and his developed mathematical metabolism model, especially the portion of lifestyle management program, have assisted him in many ways. More importantly, the quiet, stable, and undisturbed lifestyle during this quarantined period contributes to his better medical conditions control and lower lifestyle performance values. In fact, he has turned the COVID-19 crisis into his health advantage!
Keywords: COVID-19, HbA1C values, MPM analysis
INTRODUCTION
The author utilizes big data based on lifestyle details to quantitatively compare the differences between two periods: pre-COVID-19, from 5/5/2018 to 1/18/2020, and COVID-19, from 1/19/2020 to 8/29/2020.
METHODS
Background
To learn more about the GH-Method: Math-physical medicine (MPM) methodology, readers can review the article to understand his MPM analysis method [1], along with the outlined history of his personalized diabetes research and application tools development [2].
Diabetes research
In 2014, the author applied topology concept of mathematics, and finite-element technique of engineering, to develop a ten-dimensional complex mathematical model of metabolism. The metabolism model consists of four biomarker output categories such as weight, glucose, blood pressure, lipids, along with other lab-tested data (ACR, TSH, and others), and six lifestyle input categories such as food/meal, water intake, exercise, sleep, stress, and daily life routines. These ten categories further contain approximately 500 detailed elements [3]. He further defined two new parameters, metabolism index (MI), as the combined score of the above 10 metabolism categories and 500 detailed elements, and general health status unit (GHSU), as the 90-days moving average value of MI. Please note that Mi (where i = 1 through 10) represents individual metabolism score of each category. Since the development of this metabolism model took almost three years, he has defined the different break-even levels for separate categories. However, the break-even line for the overall metabolism parameters, both MI and GHSU, is 0.735 or 73.5%. When the parameter is 73.5% or above is unhealthy, whereas below 73.5% is healthy.
Since 1/1/2012, he has collected ~2 million data of his own biomedical conditions and personal lifestyle details. He has only utilized a part of his past 10-years’ big database for analysis in this article.
As a result of conducting his 10-years diabetes research efforts and using his developed mathematical metabolism model, his health condition improvements are in a format (Y2010 vs. Y2020) as follows:
Weight (lbs.): 220 vs. 171
Waistline (inch): 44 vs. 33
Daily glucose (mg/dL): 280 vs. 110
HbA1C (%): 10 vs. ~6.3
In 2017, he already achieved excellent results on all fronts, especially his glucose control. However, during 2018 and 2019, overlapping with the pre-COVID-19 period, he traveled to 50+ international cities to attend 60+ medical conferences and made ~120 oral presentations. The hectic schedule inflicted damage to his diabetes control and overall metabolism, through dinning out along with exercise disruption, and irregular life routines through traveling.
On 1/19/2020, he started his self-quarantine life, living a regular, quiet, and routine lifestyle. He eats home-cooked meals, maintains his daily routine exercise with a consistent sleep pattern. As a result, during the COVID-19 period, he reached his “best performance period” in his past 25 years of diabetes history. In a summarized biomarker near the end of August 2020, his weight is 170 lbs., waistline is 33 inches, glucose is 105 mg/dL, HbA1C is 6.0%, and SBP/DBP/HR are 108/58/57. It is obvious that his overall lifestyle during COVID-19 period has provided a solid foundation in achieving his excellent health and medical conditions. For this reason, he decided to write a special article which focuses on his lifestyle details [4].
RESULTS
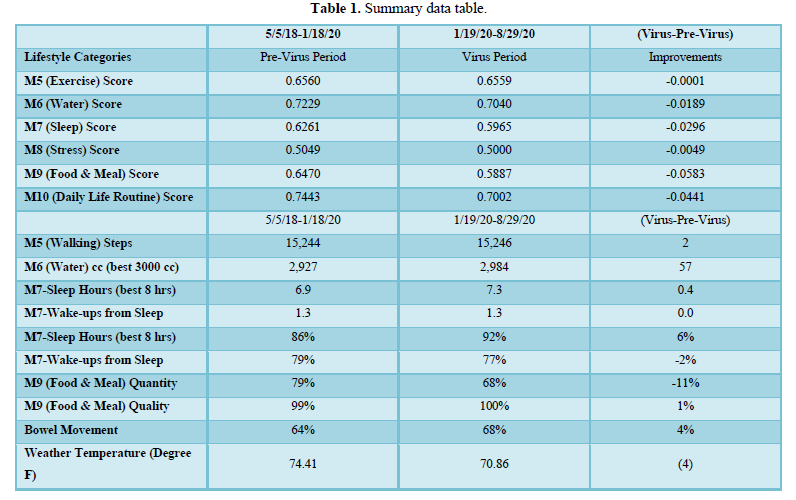
In Table 1, it shows the background data table of both lifestyle category scores and lifestyle details data during two periods.
The most important and conclusive chart is shown in Figure 1, the direct comparison of lifestyle category scores between two periods, using bar charts. The first observation is that all scores are below the break-even line of 73.5%, which means a healthy lifestyle has been maintained during these two periods. The second observation is that, while the exercise and stress categories have the same scores, all of the other four lifestyle categories (water intake, sleep, food/meal, and daily life routine) have lower scores during COVID-19 when compared to the scores of pre-COVID-19.
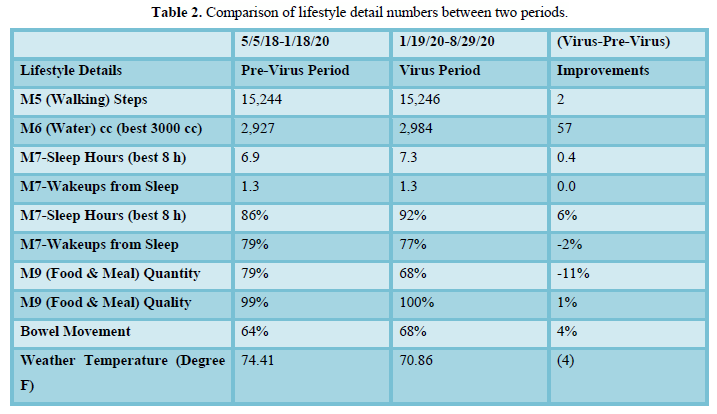
In Table 2, it depicts a table of lifestyle performance numbers instead of using the format of MI scores in Table 1.
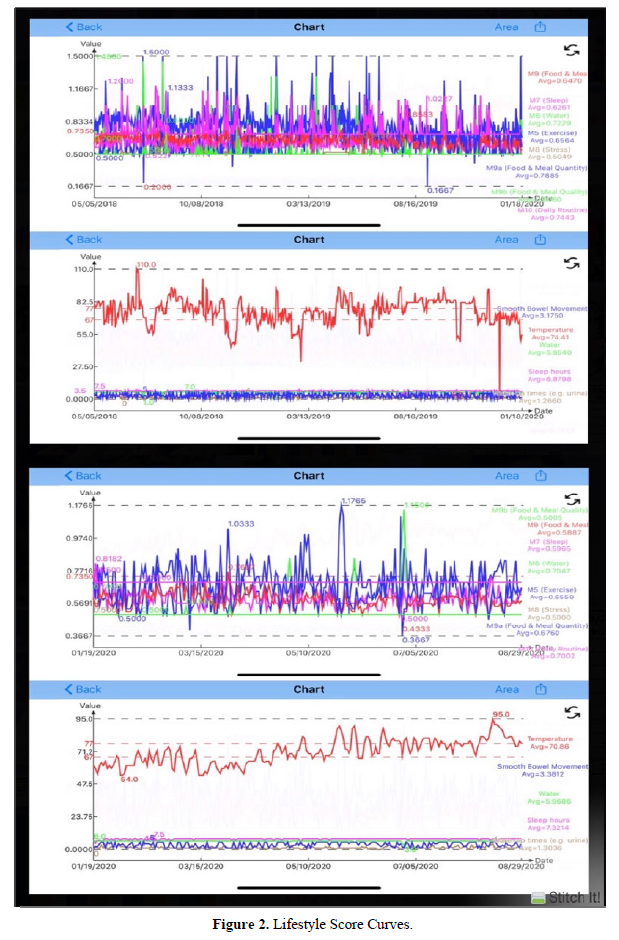
In Figure 2, it illustrates the background lifestyle curves of all the lifestyle category scores and lifestyle detail numbers.
The following section lists the key findings of 6 lifestyle categories for these two periods.
- m5 of exercise: Daily walking steps are approximately the same, around 15,245 steps.
- m6 of water intake: Daily water intake amounts are almost the same, nearly 3,000 cc.
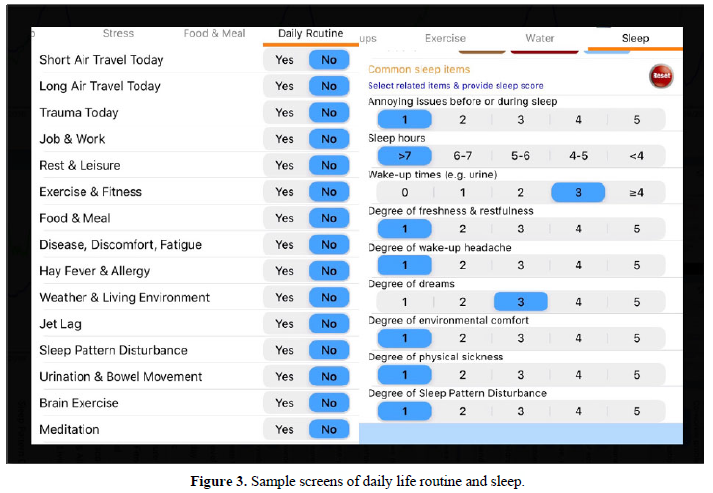
- m7 of sleep (Figure 3): He slept 6.9 hours and woke up 1.3 times each night during pre-COVID-19; and slept 7.3 h and woke up 1.3 times each night during COVID-19. He had good sleep quality for both periods, except he slept 0.4 h (24 min) longer during the COVID-19.
- m8 of stress: He has lived a stress-free life since 2015; therefore, his stress scores for both periods were near perfect with a score of 50%.
- m9 of food & meal: His meal quantity was reduced from 79% of his normal portion during pre-COVID-19 to 68% of his normal portion during COVID-19. The reduced food portion is the main factor of his weight reduction. In addition, he has maintained a “high food quality” (nearly 100%), for both periods. This high-food quality means that his meals are well balanced in nutritional requirements, low carbs/sugar contents, high quality proteins, while avoiding red-meat and processed food, and eating mainly vegetables high in fiber.
- m10 of daily life routine in (Figure 3): He follows the stringent regulations he established in 2015. The most prominent factor during COVID-19 is that he did not travel at all due to quarantine.
Other two observations are weather and bowel movement: First, the ambient weather temperature is the secondary influential factor of glucose formation, for both FPG and PPG.In the pre-COVID-19 period, the average temperature in the area was 74 degrees Fahrenheit, whereas during COVID-19, the average temperature is 72 degrees Fahrenheit. The temperature difference is only 2 degrees Fahrenheit. Second, his bowel movement conditions were 64% during pre-COVID-19 and 68% during COVID-19. A 100% bowel movement indicates his previous routine bowel movement condition prior to 2017. This data is mediocre due to his senior age with slower gastrointestinal function and his food quantity reduction (from 100% to 68%) for controlling his body weight [5,6].
CONCLUSION
The COVID-19 virus is the worst epidemic in recent human history in terms of its spreading speed, fatality number, and emotional impact on the world population. People belonging to the “vulnerable” groups, such as the elderly with medical history or existing chronic diseases and complications, require special consideration to their health conditions as well as lifestyle management program during this period. However, the author, who is 73-year-old, achieved even better results on his diabetes conditions and overall health control in terms of weight, blood pressure, glucose, and HbA1C values. The knowledge and experience he acquired in the past 10 years of medical research and his developed mathematical metabolism model, especially the portion of lifestyle management program, have assisted him in many ways. More importantly, the quiet, stable, and undisturbed lifestyle during this quarantined period contributes to his better medical conditions control and lower lifestyle performance values. In fact, he has turned the COVID-19 crisis into his health advantage!
- Hsu GC (2020) Biomedical research methodology based on GH-Method: Math-Physical Medicine (No. 310). J App Mat Sci Engg Res 4(3): 116-124.
- Hsu GC (2020) Glucose trend pattern analysis and progressive behavior modification of a T2D patient using GH-Method: Math-Physical Medicine (No. 305).
- Hsu GC (2020) Linkage among metabolism, immune system, and various diseases using GH-Method: Math-Physical Medicine (No. 235). Arch Clin Infect Dis 4(2): 23-25.
- Hsu GC (2020) Building up fundamental strength to fight against COVID-19 for patients with chronic diseases and complications (No. 253). MOJ Gerontol Ger 5(3): 76-80.
- Hsu GC (2020) Self-recovery of pancreatic beta cell’s insulin secretion based on annualized fasting plasma glucose, baseline postprandial plasma glucose, and baseline daily glucose data using GH-Method: Math-Physical Medicine (No. 297).
- Hsu GC (2020) Glucoses and HbA1C comparison study between pre- COVID-19 and COVID-19 using GH-Method: Math-Physical Medicine (No. 318). Arch Health Sci 4(1): 1-7.
-
 Table 1
 -
Table 2


QUICK LINKS
- SUBMIT MANUSCRIPT
- RECOMMEND THE JOURNAL
-
SUBSCRIBE FOR ALERTS
RELATED JOURNALS
- Journal of Immunology Research and Therapy (ISSN:2472-727X)
- Stem Cell Research and Therapeutics (ISSN:2474-4646)
- Journal of Spine Diseases
- Journal of Clinical Trials and Research (ISSN:2637-7373)
- Journal of Cell Signaling & Damage-Associated Molecular Patterns
- Oncology Clinics and Research (ISSN: 2643-055X)
- Ophthalmology Clinics and Research (ISSN:2638-115X)


