
3407
Views & Citations2407
Likes & Shares
Providing people with quality water and acceptable sanitation is a major challenge due, inter alia, to unplanned urbanization and water shortages [9,10]. The Rapid growth of cities has seriously exceeded the ability of most cities to provide adequate water and sanitation services to their citizens [11]. Water use has increased dramatically over the past 50 years due to population growth, urbanization and increased demand for agricultural irrigation [12]. Another gap identified is the impact on the sustainability of community water and sanitation programs, which are often threatened by many attitudes, institutions, infrastructure and economic factors [13].
Many water and sanitation projects in developing countries are unsustainable due to financial costs, lack of community ownership of water and sanitation infrastructure, lack of community attitude and behavior towards health education, and community participation [14]. Other challenges associated with WASH services include lack of investment in community-based and small-scale approaches [15,16] lack of reliable information (critical gap in monitoring system), weak national capacity to implement plans, insufficient funding and the most recent gap is concentrated on the gap in access to water and sanitation at the global and regional levels [17]. WASH is emerging and complex public health challenges facing communities in developing countries. Cameroon is experiencing faced the challenge of groundwater quality [18]. Therefore, groundwater pollution is an important problem because it is increasingly used for human needs. The High concentration of fecal pollutants in groundwater is a considerable health problem [19,20]. A field survey is conducted on the outskirts of Yaoundé with the aim of calculating the required distances through statistical analysis and prediction models between a well and pit latrines, verifying the respect of this distance onsite, assessing whether the current decentralized water treatment practices adopted by the population are sufficient to deal with the threat of fecal pollution, and exploring potential correlations between fecal contamination markers in groundwater with spatially distributed variables such as well or pit latrines density so as to be able.
GEOGRAPHICAL SETTING
The town of Yaoundé is located between latitudes 3° North and 5° and longitudes 11° at 12° East and is divided into seven Divisions, Yaoundé I-VII. The Melen spontaneous settlement is situated in Yaoundé VI and is part of the watershed of Abiergue. This zone is divided into five quarters: Melen VI, Melen VII-A, Melen VII-B, Melen IX and Nkolbikok II (Figure 1). There are about 15000 residents in the area, with an average of 6 per household.
The climate here is the typical equatorial type with 4 seasons, the mean precipitation is 1600 mm/year, the daily mean temperature is 24°C [22]. There are two rainy seasons (a long and a short period) from August to November and from March to May respectively. Two dry seasons as well running from December to February and from June to August.
Hydro-geologically and hydrographically, Yaoundé is in a crystalline environment, and meteorological records show that Yaoundé's environment is conducive to the recharge of groundwater level rather than the surface water flow of the basin [22]. The main drainage of the study area is Edzoa-Mballa River, which takes its source at Melen VII-A and then flows out of zone into Abiergue River (Figure 1).
Yaoundé soils are primarily composed of Precambrian deposits of metamorphic rocks, namely gneiss, mica, migmatites, and schists. Red ferrallitic soil dominates most of the area [23]. However, as deep as ten meters, this soil is leached by silica and percolating water, making it only marginally productive for agriculture.
The zone is characterized mostly by spontaneous constructions and unplanned urbanization, with a small organized portion homing well-to-do family [24]. This situation makes the area inaccessible by vehicles except for Melen VII-B and Nkolbikok-II, making impossible the collect of household waste by the company in charge of hygiene and health. This explains the accumulation of waste throughout the city and even in the vicinity of rivers.
Anthropogenic activities are very prominent in this zone as the local population strive to earn a living. These activities are of interest because they directly or indirectly have an impact on water sources, mostly through contamination of groundwater. Human activities like animal rearing (poultry, piggery, goat and sheep rearing), small commerce, garage mechanics, farming, hairdressing, brick fabric and constructions generate waste that is washed or transported mostly by rainwater, infiltrate into the ground, and contaminate groundwater [21].
The region has a wide range of social classes, from affluent families to low-income families, which affects access to adequate water and sanitation. According to the previous report of the National Institute of statistics on the region in 2011, the national water supply company provides high-quality water to 25% of the population, and the remaining 75% buy water or use wells. The company's insufficient capacity led to intermittent water supply and flooding of wells in the area. Health conditions vary because there are no centralized health systems in the region. Hence, human excrements, urine and flush water flow out pit latrines, water channel or along the road as black liquids. This situation can create contamination of nearby wells distributed as illustrated in Figure 2. Clay and laterite present a very low permeability, which implies that the upper geological units provide some protection against contamination associated with the infiltration of surface run off [22]. However, since domestic wells and pit latrines often pass through these impermeable layers, it is expected that the pollution caused by the lateral flow of groundwater will still exist. Even if this is not done, the sandy lens embedded in the clay matrix is permeable. This means that drinking wells and pit latrines can be contacted through them.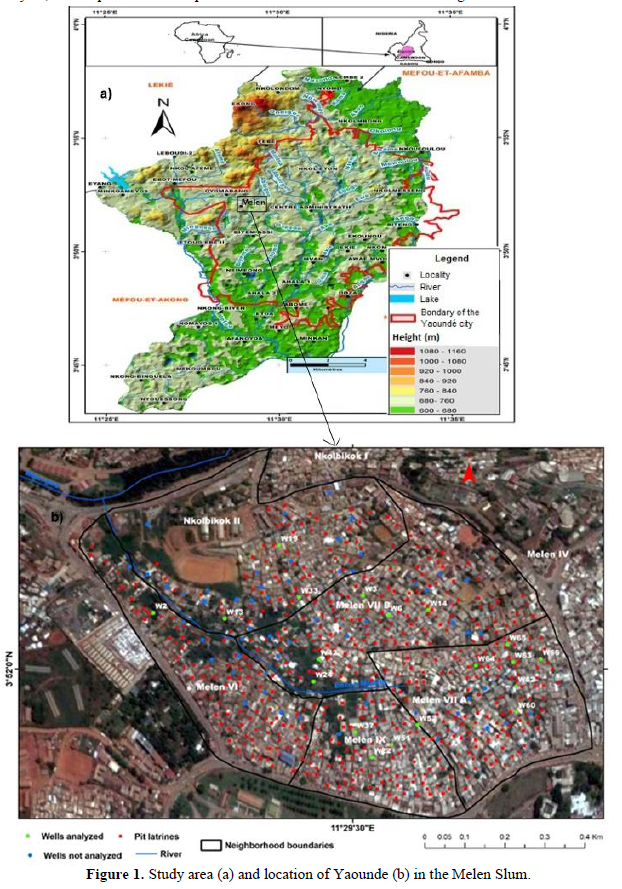
MATERIALS AND METHODS
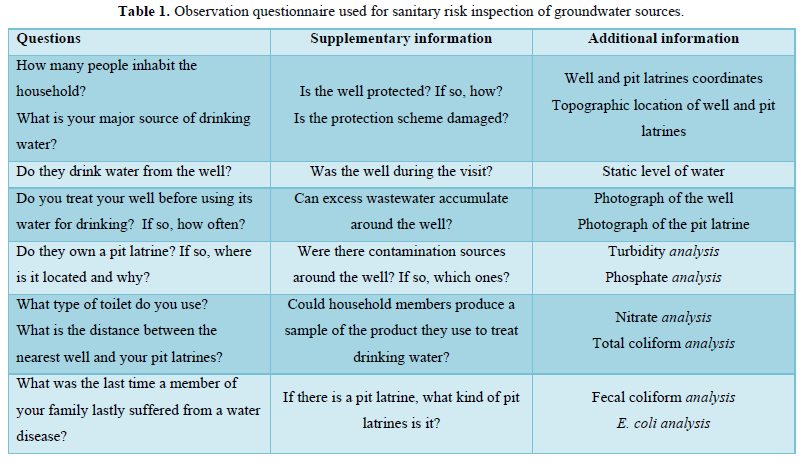
A preliminary assessment of the study area was carried out in dry season (December 2016 and January 2017). On these occasions, a questionnaire survey was conducted on 200 randomly selected families. The main objective is to determine people's understanding of the interaction between on-site sanitation and household water supply. As shown in Table 1, the survey form includes open-ended and closed-ended questions. A GPS unit of Garmin brand is used to obtain the geographical coordinates of pit latrines and wells.
However, due to the reluctance and lack of information of the populations, some answers were not obtained. Nevertheless, the database is sufficient to draw conclusive results in the analysis process.
A total of nineteen wells were sampled. Selection of sampling stations near pit latrines was done. The stations were sampled during January 2017. The water samples were collected into clean 500 ml plastic bottles, after cleaning using 0.1m HN03 (aq) and thereafter-rinsing three times with the water to be sampled. Samples were collected by lowering a weighted bottle (bottle with weights inside to facilitate sinking) down to the water level.
The analysis of the nineteen samples were made in the lab of the University of Yaoundé I. The analysis parameters are turbidity, nitrate, phosphate, Total Coliform (TC), Fecal Coliform (FC) and Escherichia coli (E. coli).
MS Excel was used to describe the data set. Based on ArcGIS software, the minimum distance between pit latrines and domestic wells is determined by simple regression method.
Simple linear regression is a technique for the analyzing the response variable x defined in equation 1 (Eq. 1):
 (1)
(1)
The parameters a and b are computed using the formulas (Eqs. 2 and 3):
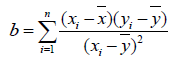 (2)
(2)
 (3)
(3)
where and are the mean value of x and y.
The mean square error (MSE) which represents how far data will fall from the regression predictions on the scale of the outcome measurements is (Eq. 4).
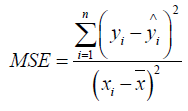 (4)
(4)
where is the predicted value of
The R2 value or multiple coefficients of determination is equal to the square of the simple correlation of x and y in simple regression. In either case, R2 can be interpreted as the fraction of the total variation in the outcome that is accounted for by regressing the outcome on the explanatory variable and given by this equation (Eq. 5).
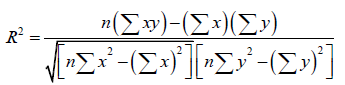 (5)
(5)
So R2 is the portion of the total variation in Y that is explained away by using the x information in a regression. R2 is always between 0 and 1.
The minimal distance needed between sanitation is the minimal distance needed so that the water characteristic will meet the standard of drinking water.
So, it’s the minimum the needed distance for water characteristics (turbidity, nitrate, phosphate, total coliforms, fecal coliforms and E-coli). Then we will have to predict thanks to the simple linear method, the minimum distances needed for each characteristic to meet the standard.
The minimal distance needed between sanitation and well will then be minimum of the distances obtained from each characteristic with an acceptable correlation.
By using GPS coordinates of wells and sanitation, the number and proportion of the recorded wells which are affected will be determined. These affected wells are those which are bore in a distance smaller than minimal distance needed.
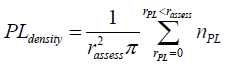
Thematic map representing the density of those infected wells and pit latrines (PL) are produced on ArcGIS software to visualize the emergence of the situation of groundwater in the study area. This density is expressed by equation 6 [25,19].
 (6)
(6)
Where, nPL is the number of pit latrines with a distance to the wells rPL within a radial area of assessment with a radius rassess [unit: Pit latrines number PL/ (Length L)2].
Whilst providing a metric of the overall number of pit latrines surrounding the borehole, the impact of pit latrines very close to a well that may pose a higher risk to the water quality may become obscured by the averaging over the larger radial area used [19].
RESULTS
Assessment results are directly representing of the living conditions of about 200 people. 98% of the respondents were women because men were outdoor during the survey. Figure 3 shows examples of some typical wells in the study area. On-site inspection showed that only 5% of household wells were protected in the form of apron and concrete well cover, and 95% of wells were not protected at all. Only 37% reported using water from improved sources as drinking water and 63% habitually used water from household wells as drinking water for everything else. Reasons for not drinking well water included health issues (19%), unpleasant taste (32%), presence of an improved water source nearby (27%), turbidity (15%), presence of obvious contaminant sources (4%) and other considerations (3%).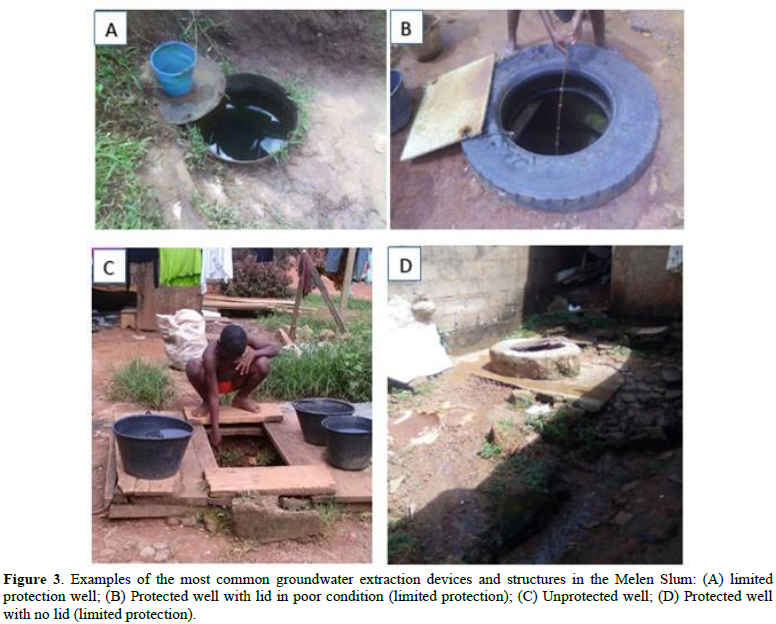
There are many groundwater pollution sources in Melen community of Yaoundé, which are as diverse as human activities. In terms of site sanitation, the following activities that may pollute groundwater were identified: poorly designed pit latrines and solid and liquid waste disposal. Groundwater pollution also results from poor site selection and design of groundwater supply infrastructure and excessive exploitation of groundwater due to the inability of national water company to provide drinking water to these residents.
Respondents believe that water pollution is a serious problem. 7% of households reported that they treat well water with bleach, which is only done once or twice a year, depending on the turbidity of the water. 20% of households reported dropping a few drops of bleach in the water before drinking. The remaining families reported that they consumed water from wells without prior treatment.
Pit latrines are the most widely used on-site system (74%), second only to septic tanks (23%), but some families still do not have sanitation facilities and use outdoor defecation (3%). The field survey provides some valuable data for people to choose the location of pit latrines. About 4% of the respondents said that they chose the location of the pit latrines to stay away from the well, while 30% said that the pit latrines were located downstream of the well to prevent water pollution. 52% of households gave reasons, including distance from house (40%) and land availability (12%). About 14% of households did not give any reason, and these results showed that most households did not establish a relationship between pit latrine and well pollution.
For parameters such as turbidity, nitrate, Total Coliforms (TC), Fecal Coliforms (FC) and E-coli, the results of all (19) sampling points are listed in Table 2. The turbidity ranged from 3.52 to 28.83 NTU with an average of 10.59 ± 7.00 NTU (Table 3). Figure 4a shows the relationship between the nearest pit latrines and the turbidity of the sampled wells. The equation of the regression line is y = -0.0926x + 12.735. Turbidity shall be less than or equal to 5 NTU; when y = 5 NTU, x is 85.58 m, and the minimum distance between pit latrines and wells is D1 = 83.58 m, while R2 = 0.0374, which means that only 3.74% of the turbidity value depends on the distance from the well. Therefore, D1 is not used because the significance of simple linear regression is too low. This significant turbidity level can be interpreted as that turbidity mainly depends on the quality and maintenance of the wells which is very random.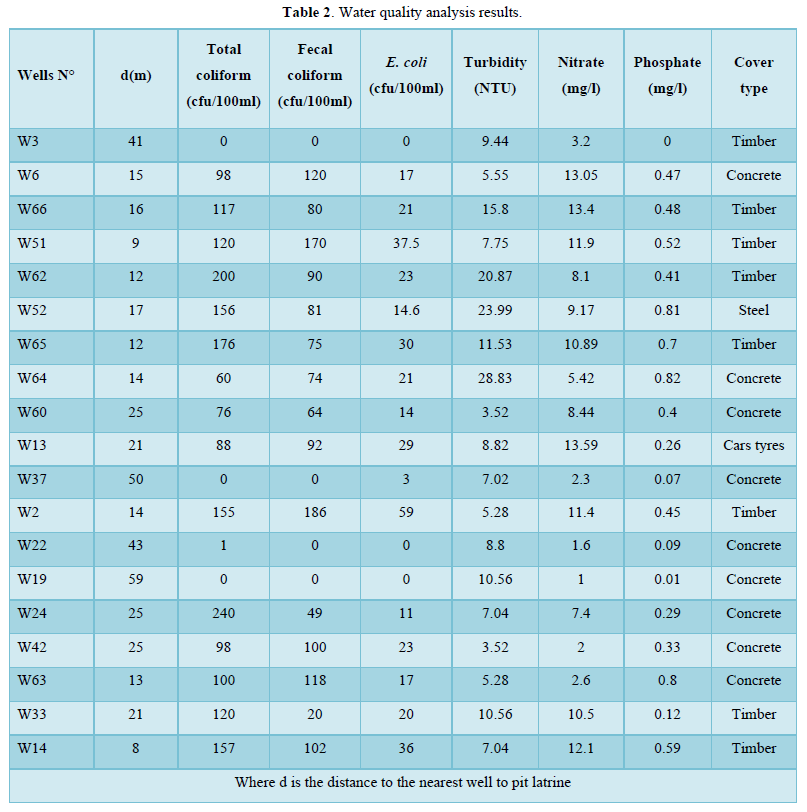
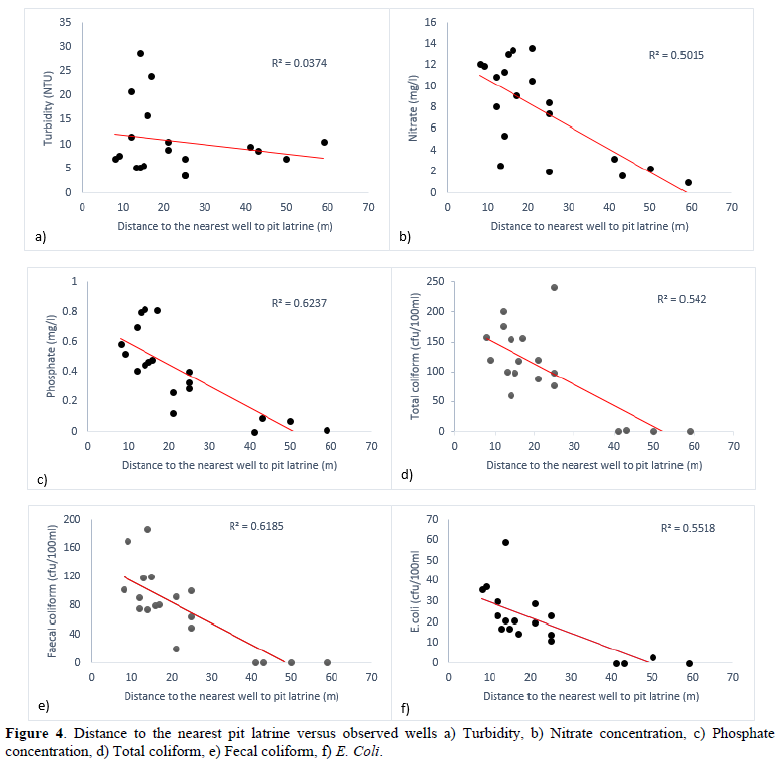
Nitrate concentration ranges between 1.00 and 13.59 mg/l, with an average standing of 7.79 ± 4.49 mg/l. The values in Table 3 show that the nitrate concentration above in 8 of the 19 sampling wells in higher than the WHO standard of 10 mg/l. This means that less than two-fifth of the sampled wells are polluted with nitrate. The equation of the regression line (Figure 4b) between the nearest pit latrines and the nitrate concentration of the sampled wells is y = -0.2175x + 12.83. The target concentration is 10mg/l; for y = 10 mg/l, we get x = 13.02, and the minimum distance between pit latrines and wells is D2 = 13.02 m; R² = 0.5015 which means that only 50.15% of the nitrate value depends on the change of wells spacing. It is highly significant, so we can assume that the concentration of nitrate in groundwater depends on distance.
Phosphate concentration ranges between 0.00 and 0.82 mg/l with an average of 0.40 ± 0.27 mg/l (Table 3). Phosphate levels in all domestic wells are lower than those recommended by WHO, which means that water is free of phosphate pollution. The equation of the regression line (Figure 4c) between the nearest pit latrines and the phosphate concentration of the sampled domestic wells is y = -0.0145x + 0.7363. The target concentration is 0 mg/l; we get x = 50.78, and the minimum distance between pit latrines and wells is D3 = 50.78 m; R² = 0.6237 which means that only 62.37% of the phosphate value depends on the change of well spacing. The difference of pollution levels is caused by the different characteristics of wells in the study area. These characteristics include type of coverage, number of residents and distance from the nearest pit latrines.
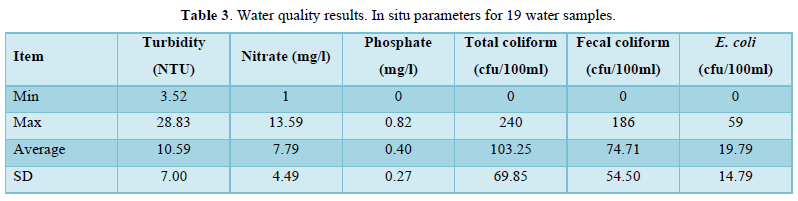
Some well water samples were observed to be contaminated by total coliform (TC), fecal coliforms (FC) and E-coli. 84% of the wells contain a large amount of E-coli., and 79% of the wells contain a large amount of total coliforms and fecal coliforms respectively. The average microbial counts of Escherichia coli, TC and FC were 19.79 ± 14.79 cfu/100mL, 74.71 ± 54.50 cfu/100ml and 103.25 ± 69.85 cfu/100mL, respectively (Table 3). The average distance between the water samples from the wells and the pit latrines is 23.11 ± 14.62 meters. The total number of coliforms in almost all sampled wells is higher than that of fecal coliforms and coliforms. Figure 4 (d, e, f) gives distance to the nearest pit latrines versus observed wells concentrations for TC, FC and E-coli. The equation of the regression line is y = -3.5192 x + 184.76 for TC, y = -2.9338 x + 142.73 for FC and y = -0.7518 x + 37.206. The minimum distance between pit latrines and wells water samples of TC, FC and E-coli is D4 = 52.50 m, D5 = 48.65 m and D6 = 49.49 m respectively. TC (R² = 0.542), FC (R² = 0.6185) and E-coli (R² = 0.5518) are highly significant, so it can be assumed that the concentration of total coliforms, fecal coliforms and E-coli in groundwater depends on the distance from the pit latrines. There was a moderate negative Pearson correlation (r = -0.737, r = -0.786 and r = -0.744) with a significant p value (p < 0.01) between pit latrines distances and TC, FC and E-coli (Table 4). In this study, there was a significant positive correlation and P value between TC and FC (r = 0.534, p = 0.02), TC and E-coli (r = 0.571, p = 0.01), FC and E-coli (r = 0.860, p <0.01) was observed (Table 4).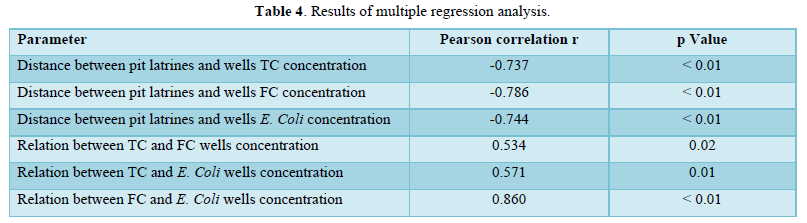
The minimal average distance required between pit latrines and all parameters of domestic wells water samples is Dmin = mean (D2; D3; D4; D5; D6) = 42.89 m. D1 is not used since the degree of significance of the simple linear regression is too low.
The minimal distance needed between pit latrines and wells is 42,89 ± 16.76 m. Now that we have computed the minimal distance needed between domestic wells and pit latrines, let us check the situation on site.
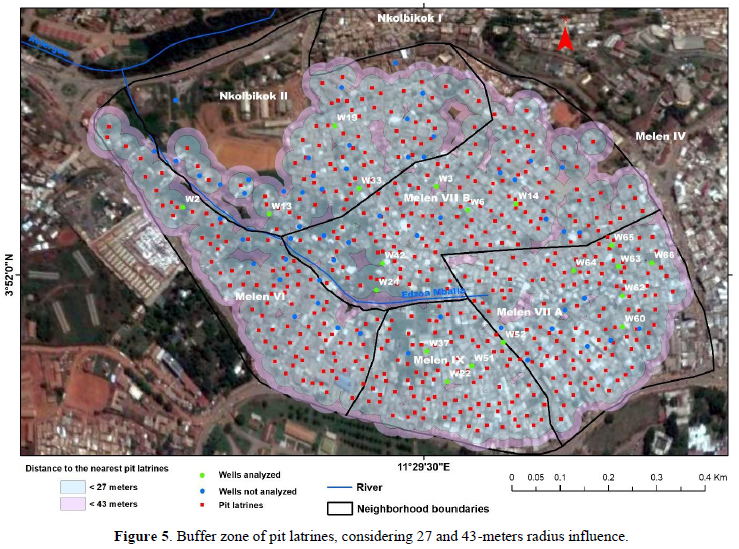
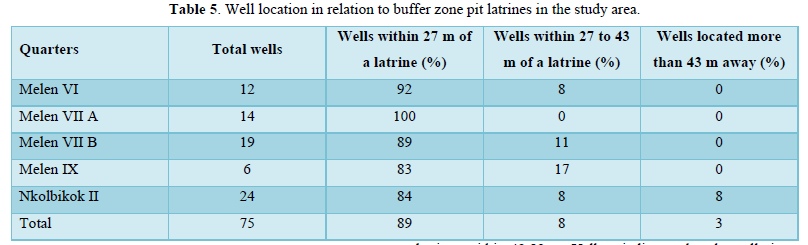
Fifty-six non-sampled wells were recorded in the study area. Only seven of them are built at least 42.89 m away from the pit latrines. That makes only 12.50 % of domestic wells that can be supposed uninfected with regard to on-site sanitation. This makes only 12.50% of household wells considered uninfected in terms of on-site sanitation. As a result, 87.50% of household wells in the region were infected. Figure 5 shows a map showing the impact range of all pit latrines and household wells identified in the area. Abundant pit latrines mean that a large number of wells are located near the sources of fecal pollution. In fact, the spatial database shows that about 89% of the wells are within 27 meters of a pit latrines, 8% between 27 and 43 meters and only 3% outside the pit impact area Table 5.
The map show in Figure 6 is produced to estimate the density of pit latrines in groundwater in the study area. Red indicates that the concentration of pollutants in groundwater is very high, which is caused by a large number of pit latrines within 42.89 m. Yellow indicates that the pollution is not serious, and green indicates areas far enough from on-site sanitation for the groundwater to be infected. From the map, we can notice that the groundwater in the area is polluted.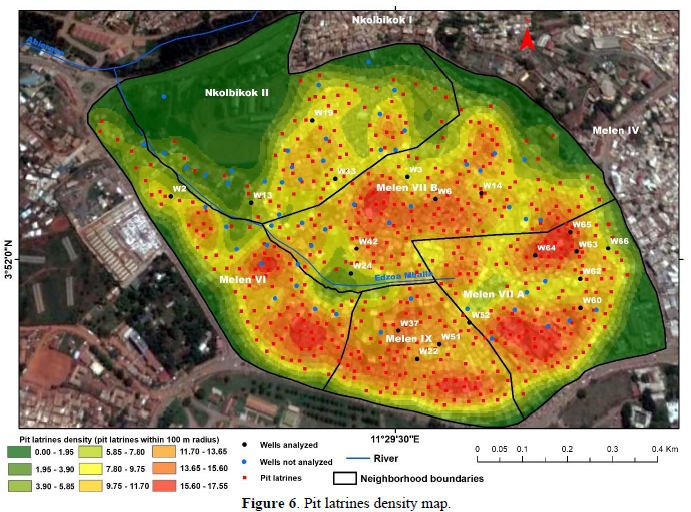
DISCUSSION
The source of bacteria in groundwater is still little known [26,27] believe that most bacteria in groundwater originate from the surface environment through the transport of pollutants during infiltration from surface water to groundwater. Therefore, bacteria in groundwater are not equally important to the quality of drinking water. Therefore, the analysis of groundwater biological parameters includes the search for bacteria. Their sources are diverse, but in developing countries, the presence of bacteria in groundwater is attributed to the lack of sanitation of domestic wastewater and especially in pit latrines [28].
The results of this study show that the pollution of groundwater by pit latrines is still a major problem in developing countries, especially Melen.
The results presented in this study suggest that the bacteria (TC, FC and E-Coli) present in most of the sampled wells are out of range. The pollution comes from the pit latrines close to the well. A previous study in Mali confirms that when the well is close to the latrine, the bacterial content is high [29].
Some protected wells were also found to have high levels of bacterial contamination (w64 and W6), which may be due to pit latrines near the well. Since this study was conducted in the dry season, due to insufficient rainfall throughout the year, it is impossible to conduct a comparative study between the rainy season and the dry season. However, a study in Bhopal, India [30] showed that the higher concentration of coliform in the dry season is due to the faster bacterial transport during this groundwater recharge period.
An attempt was made to correlate the distance between the nearest wells with chemical and bacteriological parameters, and it was found that the correlation values of several parameters other than turbidity were almost satisfactory. In this study, the minimum distance between the wells and the latrines is 42.89 ± 16.76 m. This result on the minimum distance between the wells and the latrines is equivalent to 15 m quoted by the World Health Organization [19]. Parker [31] summarized the minimum distances in national guidelines, such as 25 meters in Burkina Faso, 30 meters in Ethiopia, 50 meters in Ghana, 15 meters in Mali, 50 meters in Uganda and 30 meters in Mozambique.
The latrine density map shows a strong correlation between latrine density and non-sampled wells, indicating that these wells may be contaminated, and some users of non-sampled wells claim that they sometimes suffer from water-borne diseases. Martınez-Santos [29] observed a similar situation in Diawarrala, Fyenkala and Dougouyala villages in Western Mali.
Since most drinking water wells are polluted due to their proximity to pit latrines, one way to improve the quality of drinking water supply is to establish a decentralized treatment system in the family, install underground tanks near the wells and disinfect them with bleach every week.
CONCLUSION
Pit latrines may be an important source of well water pollution if not all precautions are taken. The depth of pit, soil permeability and the design of pit latrines can play a key role in groundwater pollution risk assessment. The purpose of this study was to estimate the minimum distance required for groundwater remediation through these remediation measures, and establish the relationship between the collected data and the analysis parameters of pit toilets and wells. This distance is 42.89 meters, and more than 97% of wells do not comply. For example, 97% of wells provide contaminated water to households. More than 59.3% of the study area was polluted. In order to avoid greater pollution of groundwater, the sanitary conditions of all buildings under construction or existing buildings must be improved. Since the collective system is unimaginable without destroying most buildings and rebuilding the area according to urban planning, the only remaining solution seems to be a centralized or semi centralized wastewater system. These systems are very similar to the field system, but have the particularity of treating a certain amount of construction wastewater in the same area.
FUNDING STATEMENT
Funding: No funding was received for this study.
DECLARATION
Conflict of interest: The authors declare that they have no known competing financial interests or personal relationships that could have appeared to influence the work reported in this paper.
DATA AVAILABILITY STATEMENT
The data used to support the findings of this study are available from the corresponding author upon request.
ACKNOWLEDGEMENTS
This paper contains research results from a MAFADY project. The Urban Community of Yaoundé 6, National School of the Public Work of Cameroon and the people of Melen Slum are acknowledged for logistical, material and moral support.
AUTHOR CONTRIBUTIONS
All authors contributed to the study conception and design. Material preparation, data collection and analysis were performed by Boris Merlain Djousse Kanouo, William Teikeu Assatse, Kasi Njeudjang; Zakari Aretouyap, Georges Nshagali Biringamine and Philippe Njandjock Nouck. The first draft of the manuscript was written by Boris Merlain Djousse Kanouo and all authors commented on previous versions of the manuscript. All authors read and approved the final manuscript.
- Prüss-Ustün A, Bartram J, Clasen T, Colford Jr, JM, Cumming O, et al. (2014) Burden of disease from inadequate water, sanitation and hygiene in low- and middle-income settings: A retrospective analysis of data from 145 countries. Trop Med Int Health 19(8): 894-905.
- Kjellstrom T, Sharon F, Dixon J, Carlos C, Eva R, et al. (2007) Urban Environmental Health Hazards and Health Equity. J Urban Health 84(1): 86-97.
- WHO/UNICEF (2014) Joint Monitoring Programme for Water Supply and Sanitation. Update: Progress on Drinking Water and Sanitation.
- UNICEF (2015) Progress on sanitation and drinking water- 2015 update and MDG assessment. Available online at: https://www.unicef.org/publications/index_82419.html
- Teikeu AW, Meli’i JL, Njandjock NP, Tabod CT, Enyegue F, et al. (2015) Assessment of groundwater quality in Yaoundé area, Cameroon using geostatistical and statistical approaches. Environ Earth Sci 75(21): 1-15.
- Baumgartner T, Pahl-Wostl C (2013) UN-Water and its role in global water governance. Ecol Soc 18(3): 1-16.
- Ravenscroft J, Liakata M, Clare A, Duma D (2017) Measuring scientific impact beyond academia: An assessment of existing impact metrics and proposed improvements. PLoS One 12(3): e0173152.
- Moe CL, Richard RD (2006) Global challenges in water, sanitation and health. J Water Health 4: ,41-57.
- Capone D, Buxton H, Cumming O, Dreibelbis R, Knee J, et al. (2020) Impact of an intervention to improve pit latrine emptying practices in low income urban neighborhoods of Maputo, Mozambique. Int J Hyg Environ Health 226: 113480.
- Yongsi HBN (2011) Access and Management of Drinking Water in Developing Cities: Evidence from Yaoundé (Cameroon). Res J Environ Sci 5: 124-133.
- Yapo RI, Kone B, Bonfoh B, Cisse G, Zinsstag J, et al. (2014) Quantitative microbial risk assessment related to urban wastewater and lagoon water reuse in Abidjan, Cote d’Ivoire. J Water Health 12(2): 301-309.
- Munir AH, Ejaz MQ (2010) Global water crisis and future food security in an era of climate change. Food Policy 35(5): 365-377.
- Mohammed AILI, Zungu, Hoque ME (2013) Access to Safe Drinking Water and Availability of Environmental Sanitation Facilities among Dukem Town Households in Ethiopia. J Hum Ecol 41(2): 131-138.
- Cohen B (2006) Urbanization in developing countries: Current trends, future projections, and key challenges for sustainability. Technol Soci 28: 63-80.
- Bassan M, Mbéguéré M, Tchonda T, Zabsonre F, Strande L (2013) Integrated fecal sludge management scheme for the cities of Burkina Faso. J Water Sanitation Hyg Dev 3: 216-221.
- Sigel K, Altantuul K, Basandorj D (2012) Household needs and demand for improved water supply and sanitation in peri-urban ger areas: The case of Darkhan, Mongolia. Environ Earth Sci 65: 1561-1566.
- Diogo CF, Graziele I, Marques RC, Gonçalves J (2021) Investment in drinking water and sanitation infrastructure and its impact on waterborne diseases dissemination: The Brazilian case. Sci Total Environ 779: 146279.
- Ako AA, Eyong GET, Nkeng GE (2009) Water Resources Management and Integrated Water Resources Management in Cameroon. Water Resour Manage 24: 871-888.
- Back JO, Rivett MO, Hinz LB, Mackay N, Wanangwa GJ, et al. (2018) Risk assessment to groundwater of pit latrine rural sanitation policy in developing country settings. Sci Total Environ 613: 592-610.
- Temgoua E (2011) Chemical and Bacteriological Analysis of Drinking Water from Alternative Sources in the Dschang Municipality, Cameroon. J Environ Prot 2: 620-628.
- Kuitcha D, Ndjama J, Awah MT, Lienou G, Beyala VKK, et al. (2010) Bacterial contamination of water points of the upper Mfoundi watershed, Yaounde, Cameroon. Afr J Microbiol Res 4(7): 568-574.
- Teikeu AW, Njandjock NP, Tabod CT, Akame JM, Nshagali BG (2016) Hydrogeological activity of lineaments in Yaoundé Cameroon region using remote sensing and GIS techniques. Egypt J Remote Sens Space Sci 19(1): 49-60.
- Ngon-Ngon GF, Yongue-Fouateu R, Bitom DL, Bilong P (2009) A geological study of clayey laterite and clayey hydromorphic material of the region of Yaounde´ (Cameroon): A prerequisite for local material promotion. J Afr Earth Sci 55: 69-78.
- Tanawa E, Tchapnga HBD, Ngnikam E, Temgoua E, Siakeu J (2002) Habitat and protection of water resources in suburban areas in Africa cities. Build Environ 37(3): 269-275.
- Wright JA, Cronin A, Okotto-Okotto J, Yang H, Pedley S, et al. (2013) A spatial analysis of pit latrine density and groundwater source contamination. Environ Monit Assess 185(5): 4261-4272.
- Ngasala TM, Masten SJ, Mantha SP (2019) Impact of domestic wells and hydrogeologic setting on water quality in peri-urban Dar es Salaam, Tanzania. Sci Total Environ 686: 1238-1250.
- Elisante E, Muzuka ANN (2016) Sources and seasonal variation of coliform bacteria abundance in groundwater around the slopes of Mount Meru, Arusha, Tanzania. Environ Monit Assess 188(7): 395.
- Bahadar N, Kjell BE, Shams AB (2017) Impact of pit latrines on drinking water contaminations in Khyber Pakhtunkhwa, Pakistan. Environ Forensics 18(4): 296-306.
- Martınez-Santos P, Martın-Loeches M, Garcıa-Castro N, Solera D, Dıaz-Alcaide S, et al. (2017) A Survey of domestic wells and pit latrines in rural settlements of Mali: Implications of on-site sanitation on the quality of water supplies. Int J Hyg Environ Health 220(7): 1179-1189.
- Pujari PR, Nanoti M, Nitnaware VC, Khare LA, Thacker NP, et al. (2007) Effect of on-site sanitation on groundwater contamination in basaltic environment: A case study from India. Environ Monit Assess 134: 271-278.
- Parker A, Carlier I (2009) National regulations on the safe distance between latrines and waterpoints. DEW point enquiry no. A0304 report (DEW Point, Blisworth, UK) commissioned by the Department for International Development (DFID). Available online at: https://www.gov.uk/dfid-research-outputs/national-regulations-on-the-safe-distance-between-latrines-and-waterpoints-final-report-december-2009
-
 Table 1
 -
Table 2
-
Table 3
-
Table 4


QUICK LINKS
- SUBMIT MANUSCRIPT
- RECOMMEND THE JOURNAL
-
SUBSCRIBE FOR ALERTS
RELATED JOURNALS
- Food and Nutrition-Current Research (ISSN:2638-1095)
- Advances in Nanomedicine and Nanotechnology Research (ISSN: 2688-5476)
- Journal of Genetics and Cell Biology (ISSN:2639-3360)
- Journal of Genomic Medicine and Pharmacogenomics (ISSN:2474-4670)
- Journal of Womens Health and Safety Research (ISSN:2577-1388)
- Journal of Veterinary and Marine Sciences (ISSN: 2689-7830)
- Journal of Microbiology and Microbial Infections (ISSN: 2689-7660)


