
5121
Views & Citations4121
Likes & Shares
- What is the level of crop diversification among farming households?
- To what extent do farmers commercialize their crop produce?
- What is the incidence, depth, and severity of poverty, and the poverty status of farmers?
- Do crop diversification and crop commercialization have effects on poverty status of the farmers?
RESEARCH METHODOLOGY
Study Area
This study was carried out in Osun State, Nigeria, and is located in the Southwest region of the country with the capital in Osogbo. It lies between latitude 7’ 30° North and longitude 4’30° East, with an average maximum and minimum temperature of 35.9°C and 18. 70C.Osun State occupies 14,875 square kilometers, it has a population of 3,423,535(National Bureau of Statistics, 2006). The state has two distinct weathers; the dry season which lasts from November to February, and rainy season which lasts from March to October. The average annual temperature is 24.7°C and average annual rainfall of 1,292mm. Osun State has thirty local government areas plus one area office, grouped into three Agricultural zones by Osun State Agricultural Development Programmed (OSSADEP); Iwo, Osogbo and Ife/Ijesa zones. Osun State is predominantly an agrarian society with about 70% of the population engaged directly or indirectly in Agriculture. The state vegetation type is tropical rain forest. This makes the state to be rich in flora and fauna species which serve as a source of raw materials to the small and medium scale enterprises within the state. The major food crops grown in the state include; yam, cassava, banana, maize, vegetable, sweet potatoes and pepper.
Data Collection
Data were collected through the use of pretested structured questionnaire administered to farmers. Data collected include information on socioeconomic characteristics of farmers, crop diversification, crop commercialization, and household expenditure.
Sampling Procedure
Multi-stage sampling procedure was used to select 210 respondents. The first stage involved the purposive selection of one local government area (LGA) from each of the three Agricultural Development Programmed (ADP) zones based on the population of food crop farmers. The second stage involved the random selection of two villages from each of the three LGAs selected in stage one. In the third stage, 35 farmers were randomly selected in each of the selected villages. However, due to incomplete questionnaire information by seven of the respondents, information from 203 copies of questionnaire were used for the study.
Analytical Techniques
Analytical tools used in this study were Simpson index, household commercialization index, Foster Greer and Thornback (FGT) poverty indices, and probit regression model.
The socio-economic characteristics of respondents were analyzed using descriptive statistics such as frequency counts, mean and percentage. Results are presented in frequency distribution tables.
Simpson Index
Simpson index of diversity (SID) was used to determine the pattern of crop diversification among farmers.
Xi = Planted area of ith crop, i= 1,2,3…7
Ai = Proportionate planted area of the ith crop in the total planted.
The index ranges between 0 and 1 (0≤SID≤1)
Scores close to 1 indicate high diversity while scores close to 0 indicate low diversity
Household Commercialization Index
Household commercialization index is the most common approach used in measuring the degreeof commercialization at the household level. Household commercialization index reveals the marketing decision of a household, particularly for produce that are potentially used for sale and home consumption. The household commercialization index (HCI) was usedto determine household level of commercialization. HCI was used by Alawode and Oladeji [17], Kabiti [18] and Ele [19].
The HCI measures the ratio of the gross value of crop sales by household i in year j to the gross value of all crops produced by the same household in the same year j expressed as a percentage. It is given as:
The index measures the extent to which household crop production is oriented towards the market. It ranges between 0 and 100 (0≤HCI≤100)
A value of zero would signify a totally subsistence-oriented household and the closer the index is to 100, the higher the degree of commercialization.
The advantage of this approach is that commercialization is treated as a continuum thereby avoiding crude distinction between “commercialized” and “non-commercialized” households.
Foster, Greer, and Thornback Poverty Measures
The poverty status of farmers was determined using the poverty measures by Foster, Greer and Thornback (FGT). Poverty line is the value of income or consumption expenditure necessary for a minimum standard of living [20]. The poverty line is two-thirds of mean per capita household expenditure. The FGT weighted measure of poverty is based on expenditure of the household and per capita household expenditure. FGT is the most widely used model of poverty measurement because it is consistent and additively decomposable [21]. The FGT index is given by 
Where Z = poverty line defined as 2/3 of the Mean Per Capita Household Expenditure (MPCHHEXP).
Yi= per capita expenditure for all households;
Q = number of poor people in the population of size N
α= poverty aversion parameter that takes values of zero, one or two (α=zero measures poverty incidence; α=one measures poverty gap and α=two measures poverty severity).
MPCHHEXP = Mean per capita household expenditure
MPCHHEXP = Total per capita household expenditure/Total number of households.
Poverty line = two-thirds of MPCHHEXP
Households were categorized into 2classes; poor and non-poor
Any household whose expenditure falls below the poverty line is regarded as being poor while any household whose expenditure is above the poverty line is regarded as non-poor.
Probit Regression Model
To analyses the effects of crop diversification and crop commercialization on the poverty status of farmers, the Probit model was used.
The dependent variable is dichotomous, that is, poor and non-poor; poor takes the value of 1 and 0, if non-poor. It is expressed thus:
Pi=Bo+ B1X1 + B2X2 + B3X3 + B4X4 + B5X5 + B6X6 + B7X7 + B8X8 + B9X9 + B10X10 + B11X11+ B12X12 + B13X13+ ei
Where Pi = Poverty status dummy (poor = 1, 0 otherwise)
Bi = Coefficients of the explanatory variables
The Explanatory Variables:
X1= Crop diversification Index (0≤SID≤1) (SID=Simpson Diversity Index)
X2= Crop commercialization Index (0≤HCI≤100)
X3 = Level of education (years)
X4 = Household size (number of people in households)
X5 = Farm size (hectares)
X6= Access to credit (yes =1, 0 otherwise)
X7 = Access to market information (yes =1, 0 otherwise)
X8 = Access to extension service (yes =1, 0 otherwise)
X9 = Market distance (yes =1, 0 otherwise)
X10= Association membership (yes =1, 0 otherwise)
X11= Access to transport (yes =1, 0 otherwise)
X12 = other occupations (yes = 1, 0 otherwise)
X13 = Crop income (Naira)
ei = Error term
RESULTS AND DISCUSSIONS
Socio-economic Characteristics of Respondents
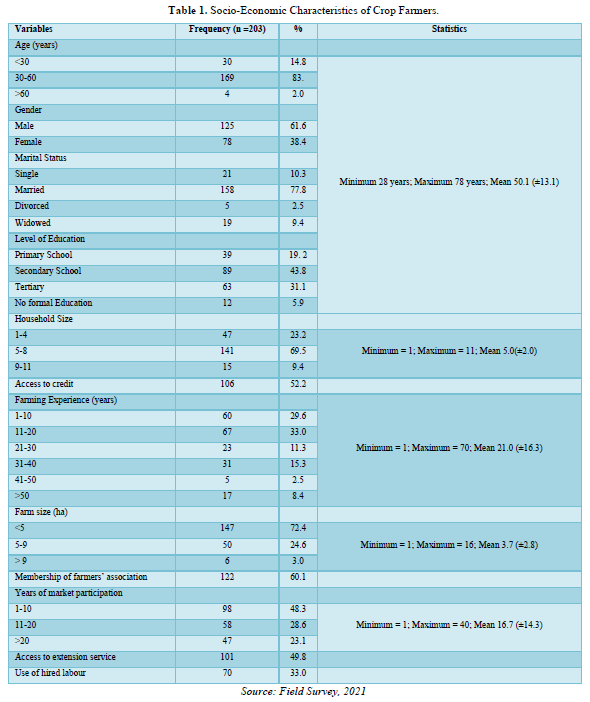
The socioeconomic characteristics of farmers are presented in Table 1. The mean age of the respondents was 50.1years (±13.1) with minimum of 28 years and maximum of 78 years. These results agree with the reports of Okali [22] that there are aging rural farm population in Nigeria and that availability of off-farm livelihood options might be necessary to retain youths within the rural farm sector. Majority (61.6%) of the respondents were male. This can be attributed to the predominance of the male headed households in both rural and urban areas in Nigeria, and the nature of farming operations which require more strength. This agrees with the tradition in the western part of Nigeria where males are expected to be the heads of the family. This result agrees with Alawode [23] who reported that farming is an occupation dominated by men, which may be due to the intensive labour requirement for agricultural activities. Also, 77.8% of the respondents were married. According to Egbetokun [24] a married man would be more committed to his work than the single man, considering the dependent(s) on him. This suggests that married farmers are more likely to practice crop diversification and may commercialize their crops. Majority (94.1%) of the farmers were literate. This result agrees with the work of Adesanoye and Okunmadewa [25] in which majority of the respondents (90%) were found to be literate. The mean household size of the respondents was 5persons (±2.0) with a minimum of 1 and maximum of 11. Most (69.5%) of the farmers had 5-8 persons. Household size is more likely to positively influence crop diversification as larger families are likely to have larger family labour [26]. Only 52.2% of the farmers had access to credit facilities in order to finance their farm and cater for their basic needs. The mean years of farming experience of respondents was 21years (±16.3), showing experience that can increase the level of commercialization. An increase in farming experience predisposes farmers to acquisition of skills and better farming practices which will increase crop production and decrease poverty incidence [27]. The mean area of land cultivated was 3.7 hectares (±2.8) with a minimum of 1 and maximum of 16 hectares. Majority (72.4%) of the farmers had farm sizes below 5hectares, implying that the farmers are mainly small-scale farmers. Lower farm sizes can limit the level of crop commercialization as farmers will make food available for their household members first. Most (60.1%) of the farmers belonged to farmers association. Membership of farmers’ group or association may increase crop commercialization and reduce poverty as farmers who are members of one association or the other may have easier access to farming incentives and markets. The mean years of market participation experience of the respondents was 16.7(±14.3). Participation in the market is a function of marketing experience. Less than half (49.8%) of the farmers had access to extension services, 33.0% of the farmers used hired labour.
Extent of Crop Diversification
Pattern of Crop Diversification among the respondents
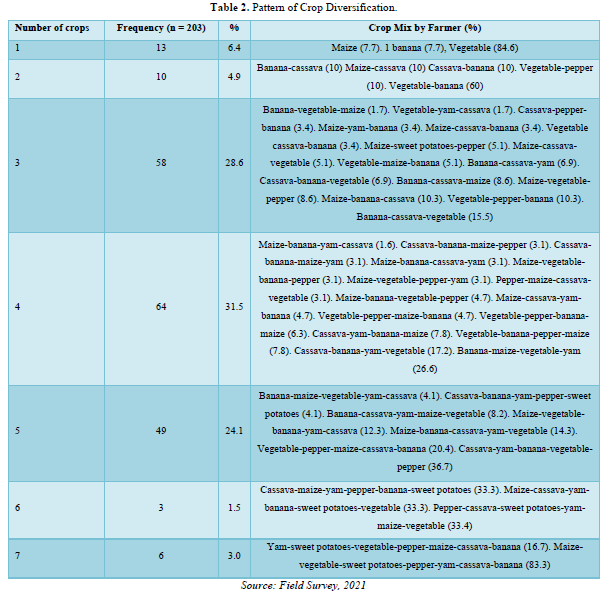
Results on pattern of crop diversification among farmers in the study area are summarized on Table 2. Results show that the highest percentage (31.5%) of the respondents cultivated four different types of crops, of which 26.6% of this category of farmers ranked the crops cultivated in the order of banana-maize-vegetable-yam. Also, 28.6% of the respondents cultivated 3 crops, out of which 15.5% of the respondents in the category ranked crops in the order of banana-cassava-vegetable. Only 24.1% of the respondents cultivated 5 crops out of which 36.7% of the respondents in the category ranked their cropping activities in the order of cassava-yam-banana-vegetable-pepper. Very low proportions; 4.9% and 1.5% of the respondents cultivated 2 crops and 6 crops, respectively. Only 3.0% of the respondents cultivated the seven most common crops in the study area while 6.4% of the respondents did not diversify at all (specialization). Those that are highly diversified cultivated at least four crops; those that moderately diversified cultivated either two or three crops, while those that did not diversify cultivate only one kind of crop among the seven crops studied. Crop diversification is a strategy adopted to ensure farmers secure their livelihood. In all, 93.6% of the farmer engaged in crop diversification (Table 2).
Diversity index
Results in Table 3 show the distribution of farmers according to diversity index. Following Simpson Index of Diversity (SID), respondents with the most diversified cropping activities had SID that approaches 1 and those with the less diversified cropping activities had SID that tends towards zero. Findings show that 6.4% of the farmers had a diversity index of 0, implying that very few of them were specialized in production of one crop (as established in Table 2). Most (66.5%) of the crop farmers had diversity index between 0.51-0.75 with mean crop diversification index of 0.64 (±0.20), implying that the farmers are moderately diversified in crop production. This supports the result in Table 2 that majority of the farmers (93.6%) diversified between 2 and 7 crop combinations.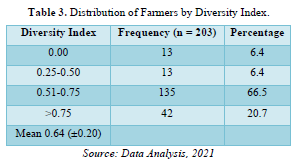
Reasons for Crop Diversification
As presented in Table 4, most of the respondents had various reasons for crop diversification instead of concentrating on the most profitable crop. Majority (92.0%) of the farmers diversified to ensure food availability and access of farming households to different crops throughout the year, and also reduce the amount spent on food consumption. This suggests that crop diversification is more connected to provision of food for farm households. Also, majority (91.5%) of the crop farmers indicated they practiced crop diversification to increase the scope of income sources due to the seasonality of agricultural crops. From the results, 77.0% of the farmers diversified because of increase in price and demand for such crops in the previous production year, while 69.5% diversified due to low land fertility and productivity. Also, 60.0% of the farmers diversified due to environmental problem, while 15.0% of the farmers diversified because they inherited the practice from their parents and/or diversification is a societal norm of farming in their areas.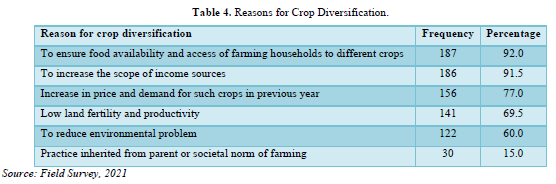
Extent of Crop Commercialization
Results on the extent of household crop commercialization are presented in Table 5. Most (69.0%) of the respondents sold 50.1% to 75% of their total crop output. Majority (92.1%) of the farmers in the study area were market oriented and sold minimum of 50% of the total crop produced. However, 23.1% of the respondents sold above 75% of their total crop produced. The closer the index is to 100, the higher the degree of commercialization. This implies that 23.1% of the respondents had high levels of commercialization. Meanwhile, 5.9% of the respondents sold 25.1% to 50% of their total crop output, implying that 5.9% of the respondents were less commercialized. Also, 2.0% of the respondents did not sell any of their total output (subsistent). The mean household commercialization index was 0.66 (±15.27). This means that on the average, respondents sold 66% of their total crop output. This shows that on the average, farmers in the study area were 66% commercialized; they participated in the market, and this offers opportunities for increasing their farm income.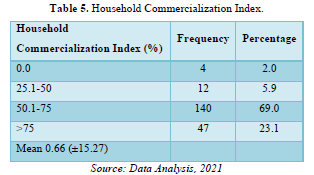
Constraints to Crop Commercialization
Constraints to crop commercialization by farmers are presented in Table 6. All the constraints were identified by more than 50% of the farmers but lack of storage facility (95.6%) and low credit accessibility (81.8%) were identified as the most significant constraints that limit participation of farmers in crop market. Land tenure system was identified by 76.4% of the farmers as a constraint militating against commercialization because land is not readily accessible for crop production as a result of the land tenure system. The activities of middlemen were identified by 68.5% of the farmers as a constraint militating against crop commercialization. Most farmers in the study area depend on middlemen in getting their crops sold. Middlemen serve as bottleneck against crop commercialization due to their activities in ensuring they maximize their own profits. Also, 67.5% of the farmers identified unattractive market price as one of the constraints militating against crop commercialization.
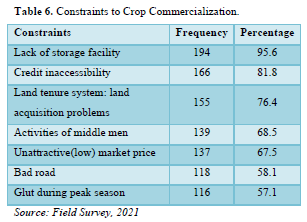
Bad roads were identified by 58.1% of the farmers as a constraint because in most farm areas, good access roads are often lacking and where they are available, they are mostly not motorable throughout the year because there are potholes which make it difficult for vehicles to get to farm sites to evacuate farm produce. In the same vein, glut during peak season was identified by 57.1% of the farmers. Glut during peak season occurs during the harvesting season as most of the farmers take their produce to the market during the same period, creating supply surplus and reduced prices which eventually leads to fall in farmers' income. Glut during peak season may discourage farmers from producing market-oriented crops.
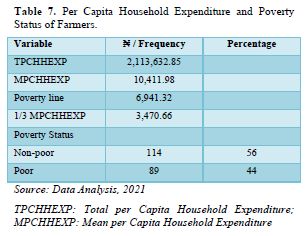
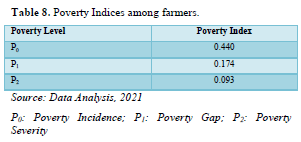
Poverty Status of Farmers
From the results in Tables 7 & 8, total per capita farmer expenditure was found to be ₦2,113,632.85. The mean per capita household expenditure was estimated to be ₦10,411.98. The poverty line which represents 2/3 of the mean per capita household expenditure was estimated as ₦6,941.32. This means that any farmer whose per capita expenditure was below ₦6,941.32 was regarded as poor and any farmer whose per capita expenditure was above ₦6,941.32 was regarded as non-poor. From the results, 44% of the respondents were poor while 56% were non-poor. With a poverty line of N6,941.32, from Table 8, the incidence of poverty (Po) or poverty head-count of the farmers in the study area was 0.440. This is the proportion of the farmer that could not afford basic needs. The value indicates that 44% of the respondents in the area were below the poverty line and were therefore relatively poor. The poverty depth or gap (P1) was estimated at 0.174, which means that 17.4%of the poverty line, that is, ₦1,207.79 was required to move an average poor farmer out of poverty. The poverty severity or intensity was 0.093. This implies that 9.3% of the farmers were severely poor; 9.3% represents the poorest among the poor farmers who require the attention of policy makers in the distribution of the standard of living indicators, such as health care services, clean water and income generating activities. National Bureau Statistics (2008) put the poverty incidence in South West in 2004 at 43%. Also, National Bureau Statistics [28] in May 2020 put the poverty incidence in Nigeria at 40.1% with 52.1% in the rural sector. Comparing these statistics, it shows that the poverty incidence (44%) obtained for farmers sampled for this study area is supported by the report of National Bureau Statistics (2008; 2020).
Effects of Crop Diversification and Crop Commercialization on Poverty status of farmers
The results of Probit regression model to determine the effect of crop diversification and crop commercialization on poverty status among farmers in Osun State are presented in Table 9. The χ2 statistics test the null hypothesis of all estimated coefficients taken together being equal to zero. The likelihood ratio statistics as indicated by χ2 statistics (115.35) are highly significant (P<0.0000), suggesting the model has strong explanatory power. Practicing crop diversification, years of education, household size, access to credit, market information, being member of farmers’ association, access to transport facility, having other occupations, and crop income were the major determinants of poverty in the study area. The coefficients of crop diversification, household size, access to credit and access to transport facility were positive which implies that these variables may likely increase the probability of being poor.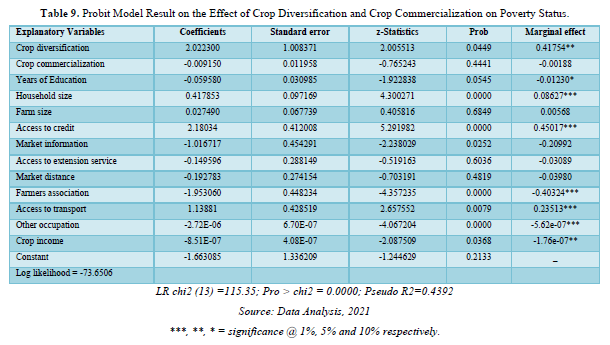
Crop diversification
The results show that crop diversification was positively related to poverty status and was significant at 5%. This implies that as crop diversification index increases, the probability of the farmers being poor also increases. This implies that 1% increase in crop diversification index increases the probability of the household being poor by 41.8%, indicating that the more a farmer diversify in crop production, the more the probability that he is a poor farmer. These results show that the more the crop diversification index of a farmer tends towards 1, the poorer the farmer becomes. This implies that poor farmers are those that have higher Simpson index.
Crop commercialization
Results show that crop commercialization had no significant effect on poverty status. However, it had a negative relationship to poverty. The negative relationship means that the higher the farmer’s commercialization index, the lower the probability of being poor.
Other socio-economic variables
Years of education of the farmer was significant and it had the expected sign of being inversely related to the probability of the farmer being poor. The coefficient of education, being significant at 10% level, confirms that education has strong impact on poverty status. One-year increase in the level of education of farmer reduces the probability of the farmer being poor by 1.2%. Household size was a significant determinant of poverty status among farmers in the study area. Results show that the marginal effect of household size is significant at 1% level, and increase in household size by 1 person will increase the probability of that household being poor by 8.6%, indicating that larger households have greater probability of being in poverty. Access to credit by farmers was significant at 1% level but contrary to a priori expectation, it was positively related to poverty status. This result shows that access to credit will not probably aid the farmer’s escape from poverty. This could be as a result of higher interest rates by most lending organizations in the study area. Also, farmers could be diverting the fund into non-economic activities. Increased credit access by farmers in the study area will increase the probability of the farmers being poor by 45%.
Access to market information was significant at 5% level and negatively related to poverty status. Following a priori expectation, the more the market information available for crop production decision making, the lower the probability of being poor. Farmers that have access to market information have the probability of escaping from poverty increased by about 21%. In line with a priori expectation, belonging to farmers’ association is a poverty reducing factor. Results show that belonging to farmers’ association decreases the probability of being poor by 40%. This might be as a result of the fact that most farmers association are involved in many agricultural value-added activities.
Contrary to a priori expectation, access to transportation facility was found to increase the probability of being poor. An improved access to additional transport facility unit will cause a 23.5% increase in the probability of a farmer sinking deeper into poverty. This could be due to poor rural roads which leads to high transportation cost.
Having other occupations in the study area was significant at 1% level and also negatively related to poverty status. A farmer involved in other occupations has about 0.00006% probability of escaping from poverty. In line with a prior expectation, having other job lowers the probability of being poor. Income from crop cultivation was inversely related to the poverty status of the farmers, and significant at 5% level. This shows that as the income from crop cultivation activities increases, the probability of being poor decreases; ₦1 increase in income from crop production reduces the probability of a household being poor by 0.00002%.
CONCLUSION
In this study, the relationship between crop diversification, crop commercialization and poverty status are established. Farmers should diversify less and concentrate on most profitable crops as practicing crop diversification increases the probability of being poor. The findings in this study clearly helps to reach a conclusion that higher crop market participation among farmers should involve making broad production decision not only to satisfy basic community or households needs, but also to produce for the market. This study has shown that having other occupations play a very important role in augmenting crop-income in order to reduce the level of poverty among farmers in the study area. This is an indication that crop cultivation alone may not be an adequate source of revenue for the farmers.
Educating farmers on the benefits of diversifying less and embracing specialization in crop production will enhance crop market participation in order to increase their levels of commercialization, which will help farmers to escape poverty. Also, farmers’ associations should be more organized to develop an effective integrated marketing information system. This will help farmers in selling produce at uniform prices. This will also help in reducing excess crop production that causes glut which could cause selling their produce at very low price. All these are with a view to enhancing commercialization and reducing poverty.
- Joshi PK (2005) Crop diversification in India: Nature, Pattern and drivers. Int Food Policy Res Institute 11(11): 2303-2308.
- Truscott L, Aranda D, Nagarajan P, Tovignan S, Travaglini AL (2009) A snapshot of crop diversification in organic cotton farms. Discussion paper. Available online at: https://silo.tips/download/a-snapshot-of-crop-diversification-in-organic-cotton-farms
- Ojo MA, Ojo AO, Odine A, Ogaji A (2014) Determinants of crop diversification among small–scale food crop farmers in north central, Nigeria. Prod Agric Technol J 10(2): 1-11.
- Shoffner AV, Tooker JF (2012) The potential of genotypically diverse cultivar mixtures to moderate aphid populations in wheat (Triticum aestivum L.) Arthropod Plant Interact 7: 33-43.
- Kurosaki T (2003) Specialization and diversification in agricultural transformation: The case of West Punjab, 1903-1992. Am J Agric Econ 85(2): 372-386.
- Jaleta M, Gebremedhin B, Hoekstra D (2009) Smallholder commercialization: Processes, determinants and impact. Discussion Paper No. 18. Improving Productivity and Market Success (IPMS) of Ethiopian Farmers Project, ILRI (International Livestock Research Institute). Nairobi, Kenya. Available online at: https://www.marketlinks.org/sites/default/files/resource/files/ILRI/Smallholder/Commercialization/Processes.pdf
- Liverpool TLS, Kuku O, Ajibola A (2011) Nigeria Strategy Support Program; Working Paper No. 21, International Food Policy Research Institute: Washington, DC, USA. Available online at: https://core.ac.uk/download/pdf/250604489.pdf
- Immink MDC, Alarcon JA (1993) Household income, food availability and commercial crop production by smallholder farmers in the western highlands of Guatemala. Econ Dev Cultural Change 41(2): 319-342.
- Amao JO, Ayantoye K, Fadahunsi OD (2013) Poverty among farming households in Osun State, Nigeria. Int J Humanit Soc Sci 3(21): 1-12.
- Omonona BT, Oni OA, Uwagboe AO (2006) Adoption of improved cassava varieties and its welfare impact on Rural Farming Households in Edo State, Nigeria. J Agric Food Inf 7(1): 39-55.
- McClelland A (2000) No child: Child poverty in Australia. Ethiop J Health Sci 59(3): 44-52.
- Awotide BA, Awoyemi TT, Oluwatayo IB (2015) Gender Analysis of Income Inequality and Poverty among Rural Households in Nigeria: Evidence from Akinyele Local Government Area, Oyo State. J Biol Agric Healthcare 5(3): 20-27.
- United Nation Educational Scientific and Cultural Organization (2015). Learning to Live Together; poverty. Available online at: www.unesco.org/new/en/socialandhumansciences/theme/international-migration/glossary/poverty
- Von BJ, Hill RVl, Pandya LR (2009) The Poorest and Hungry: Assessments, Analyses and Actions. International Food Policy Research Institute, Washington, D.C.
- World Bank (2006) World Development Indicators. World Bank, Washington, D.C.
- Babatunde RO, Olorunsanya EO, Adejola AD (2008) Assessment of Rural Household Poverty: Evidence from South Western Nigeria. Am-Eurasian J Agric Environ Sci 3(6): 900-905.
- Alawode OO, Oladeji OA (2020) Land Access, Land Use Conflict and Smallholder Commercialization in Southwest Nigeria. J Agric Res 5(3): 1-12.
- Kabiti HM, Raidimi NE, Pfumayaramba TK, Chauke PK (2016) Determinants of agricultural Commercialization among smallholder farmers in Munyati resettlement area, Chikomba district, Zimbabwe. Int J Hydrog Energy 53(1): 10-19.
- Ele IE, Omini GE, Adinya B (2013) Assessing the extent of commercialization of smallholding farming households in Cross River State, Nigeria. J Appl Vet Sci 4(2): 49-55.
- Aigbe FO, Isiorhovoja RA (2013) Crop Productivity, Land Degradation and Poverty Nexus in Delta North Agricultural Zone of Delta State, Nigeria. J Atmos Sci 5(4): 85-93.
- Foster JE, Greer J, Thorbecke E (1984) A class of decomposable poverty measures. Econometrical 52(1): 761-766.
- Okali D, Okpara E, Olawoye J (2001) The Case of Aba and its Region, South Eastern Nigeria. Working Paper Series on Rural-Urban Interactions and Livelihood Strategies. Human Settlements Programme, IIED.
- Alawode OO, Akuboh JO, Abegunde VO (2016) Agricultural Intensification and Poverty among Farmers in Kogi State, Nigeria. Int J Innov Agric Biol Res 4(2): 37-45.
- Egbetokun OA, Omonona BT, Ademola SA (2014) Land Degradation and Its Impacts on Technical Efficiency of Maize-Based Farms in Oyo State, Nigeria. Asian J Soc Sci 2(5): 74-79.
- Adesanoye SA, Okunmadewa FY (2007) Employment creation and opportunities in the agro-allied subsector, Osun State: The case of cassava production. J Atmos Sci 21(2): 3.
- Abdalla S, Leonhäuser I, Siegfried SB, Elamin E (2013) Factors influencing crop diversity in dry land sector of Sudan. J Agric Res 2(7): 88-97.
- Ahmed FF, Eugene CE, Abah PO (2015) Analysis of Food Security among Farming Households in Borno State, Nigeria. J Agric Econ Environ Soc Sci 1(1): 130-141.
- National Bureau of Statistics (NBS) (2020). 2019 Poverty and Inequality in Nigeria: Executive Summary. Abuja, Nigeria. Reported May, 2020. pp: 25.
-
 Table 1
 -
Table 2
-
Table 3
-
Table 4
-
Table 5
-
Table 6
-
Table 7
-
Table 8
-
Table 9


QUICK LINKS
- SUBMIT MANUSCRIPT
- RECOMMEND THE JOURNAL
-
SUBSCRIBE FOR ALERTS
RELATED JOURNALS
- Advances in Nanomedicine and Nanotechnology Research (ISSN: 2688-5476)
- Proteomics and Bioinformatics (ISSN:2641-7561)
- Journal of Genetics and Cell Biology (ISSN:2639-3360)
- Journal of Biochemistry and Molecular Medicine (ISSN:2641-6948)
- Journal of Womens Health and Safety Research (ISSN:2577-1388)
- Journal of Astronomy and Space Research
- Journal of Genomic Medicine and Pharmacogenomics (ISSN:2474-4670)


