Journal of Agriculture and Forest Meteorology Research (ISSN:2642-0449)

Research Article
Formulation of WEAP Based Water Allocation Plan of a Rain-Fed Micro-Watershed, Chhattisgarh, India. Water Allocation Plan of a Rain- Fed Watershed Using WEAP
5818
Views & Citations4818
Likes & Shares
Water resource allocation has always been a challenging task for policymakers and yet an important issue for effective water resource management. The WEAP model with its advanced feature of priority-preference-based simulations can be used as a powerful integrated water resources management (IWRM) tool for modeling future water demand and supplies to analyze the demand pattern in a simple to complex watershed systems. The present manuscript applies WEAP21 to assess impacts of the likely future water use on water resources of a rainfed milli-watershed of 5035 ha with an approximate annual rainfall of 1200 mm in Kanker District of Chhattisgarh, India which is also recognized under Integrated Watershed Management Programme (IWMP) for sustainable water resources planning. The model results show the variation in demand pattern with time and demand coverage at all sites with the changing demographic and climate data as compared to reference scenario suggesting the need for alternate supply sources in the coming period. The water stress in each scenario has been shown in the form of unmet water demands under the population growth scenario, supply augmentation scenario, and demand management scenario. The most promising scenario to reduce the unmet demands was demand management by restoring the water bodies.
Keywords: Chhattisgarh, Rainfed, Sustainable water resources management, Water allocation, WEAP
HIGHLIGHTS
- Water resources management is important
- Supply-demand analysis in rainfed watershed
- Rejuvenation of natural water bodies is a must
- The findings of WEAP are important for optimal water allocation planning
INTRODUCTION
With the increasing pressure on existing water resources, the present framework of the water allocation system is becoming highly inefficient. One of the prime reasons for the failure of the existing water allocation system to meet the current water demands is the poor water management policies adopted in the past. Different sectors can interact and influence the water strategies for water resource development and management. There is a huge competition to access water resources at the global level, national level, and local level due to population growth, climatic variations, and economic development. With the increasing living standards and urbanization, the water consumption rate is rising significantly and therefore putting more stress on the available water resources. The water consumption rate, urbanization, and rising living standards have a strong correlation, and these factors are putting more stress on the available water resources [1,2]. According to the research, climate change is also significantly affecting the hydrological cycle. With the changing Earth’s climate, even under the most optimistic scenarios of emissions and climate sensitivity, impacts are inevitable [3-5]. Water resources planning, therefore, needs a multidisciplinary approach that brings together all the complexities of the actual system. Formulation of water allocation policies incorporating an integrated approach can be one of the effective management strategies. Conventional supply-oriented simulation models are sometimes inadequate. Over the last decade, an integrated approach to water development has emerged that place water supply projects in the context of demand-side issues, water quality, and ecosystem preservation [6]. Integrated Water Resources Management (IWRM) is viewed as the systematic process for sustainable development, allocation, and monitoring of the water resources considering all the different user groups together to achieve socio-economic and environmental objectives [7]. The main objective is the optimum allocation of resources to each of the user group ensuring sustainable management without disturbing the ecosystem to achieve social-economic and environmental objectives. The water allocation is also important to narrow down the gap between existing demands and water supply [8].
The Water Evaluation and Planning (WEAP) model of the Stockholm Environment Institute is one such IWRM based tool that integrates all the components of a watershed and provides a modeling framework for the evaluation of water demand and supply across various sectors of a watershed be it simple or complex. Its advanced version i.e., WEAP21 incorporates an enhanced feature of demand analysis in which users can customize the model as per the assigned priorities to demand sites using water from the preferred source of supply [9-11]. This model has been widely used for water resources planning and management in areas subjected to frequent droughts, floods, rainfed areas or water quality issues, conjunctive use management, etc.
The present study focuses on using WEAP as a decision-making tool for water allocation problems and water resources planning in various aspects for one of the watersheds under the integrated watershed management program (IWMP) under the Government of India. The IWMP-XIV watershed in Mandri River Catchment in Kanker District, Chhattisgarh, India was chosen to formulate a water allocation plan using the WEAP model. The region even after receiving a considerable amount of average annual rainfall of more than 1200mm has been facing an acute shortage of water in the past few years. About 90% of the rainfall is received from July to September. The economy of the region is predominantly agrarian with over 70% of the population is dependent on agriculture. Most agriculture is rainfed, so farmers are highly dependent on the monsoon rains during the Kharif season. For most of the year, the region experiences an acute scarcity of water for domestic and agricultural use. Moreover, the region mostly depends on groundwater as its source of supply due to the lack of pipelines in the area which has resulted in considerable depletion of groundwater in the area.
The present study focuses on the use of identified software system i.e., WEAP for assessing water supply and demand under current sources of supply and evaluating the demand pattern under changing population growth scenarios. The study also assesses the impact of changing climate including changing stream flows and percolation rates on the unmet water demand and analyses the effects of changing supply (supply augmentation) and demand management strategies on unmet water demand in watershed thereby suggesting suitable measures.
GRAPHICAL ABSTRACT
MATERIALS AND METHODS
Study area
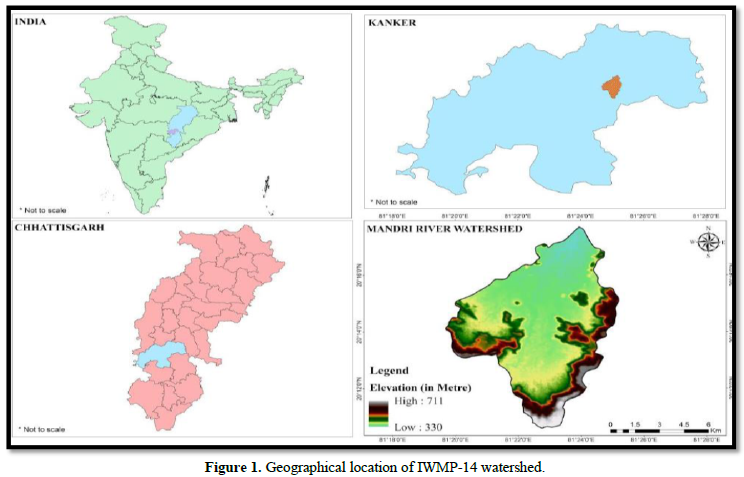
The study area is a milli-watershed i.e., IMWP -14, one of the watersheds under the integrated watershed management program by the Government of India. This watershed lies in the Kanker administrative block of Kanker district, Chhattisgarh, India. It is located between 20°10’0” N -20°16’0” N latitude and 81°18’0” E - 81°28’0” E longitude, having a total area of 5035 ha (Figure 1).
The watershed comprises nine villages and 10 micro-watersheds. It falls in the Middle Mahanadi basin. Mandri river is the major stream flowing through the area. On average, the region experiences an annual rainfall of around 1200mm, approximately 90% of which falls during the period from June to September. The average annual rainfall has fluctuated greatly over the last six years. Agriculture is the major activity for livelihood. The majority of the rainfall occurs in the Kharif season thereby making it a rainfed region. Majorly, the population depends on groundwater sources in the form of wells, tube wells to meet their domestic demands. During Rabi season due to lack of rainfall and water management, farmers face huge water stress that can be explained by the frequency of droughts in many of the villages. Also, groundwater depletion is prevailing in the area due to over dependency. The topography of the watershed is undulating. The watershed has a maximum elevation of 727m above mean sea level and a minimum elevation of 329m above mean sea level. The overall drainage pattern of the watershed is dendritic. Morphometric analysis showed that it had five order streams. The climate of the watershed is semi-arid with four seasons.
May is generally the hottest month with the mean daily maximum temperature at about 43 degrees Celsius and December being the coolest with the minimum mean temperature of about 15 degrees. The maximum relative humidity is generally around 80% during the monsoon season with a minimum of 35% during the dry season. The land use/land cover data gives detailed information regarding areas under different uses namely agriculture, river and water bodies, forest, built-up, etc. Most of the study area is under agriculture (total cultivated area- 3287 ha) which is 65.2% of the total watershed area. Paddy, maize, tomato, gram, chickpea, etc are the major crops grown in the area. The soil in the region originates from granite, gneiss, sand, and Khadar. Most of the area is covered with sandy-loamy soil. The other soil types include clay-loamy and sandy-clayey soil. The soil is faintly colored in the higher regions of the hilly tract, while in the river valleys, the soil is smooth and fertile.
WEAP MODEL SETUP
WEAP uses inbuilt hydrologic modules to simulate water demand and various other parameters in the catchment. Demographic data such as population (cap) and Livestock (cap) were obtained from the census of India. The Annual Water use rate(liters/cap) was obtained from district websites. The Climatic data as Precipitation(mm), ETref (mm/day) have been taken from India Meteorological Department (IMD). The Land-use data such as total land area(ha) and share of land area under each class and for each crop has been taken from the Detailed Project Report (DRP) of the watershed development published by the IWMP team of Kanker district, Chhattisgarh. The crop coefficient (Kc) values have been taken from the various agriculture research literature completed in the study area.
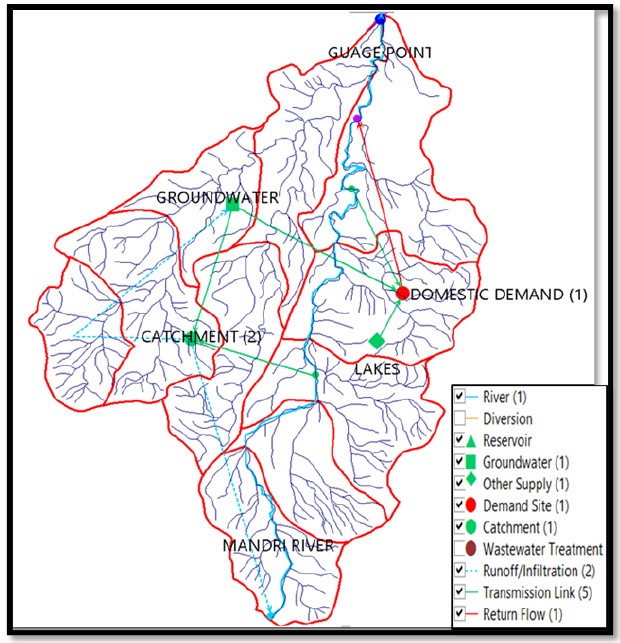
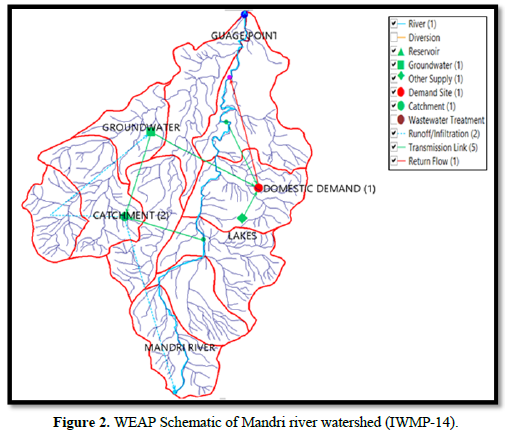
The vector files of drainage pattern and watershed boundary were imported in the WEAP model and demand sites (population and livestock), catchment nodes, supply source were linked with the transmission links. The study area is a rural area where industries are not present, so there is no industrial demand node in the area. The above-mentioned data on various demands, climatic data were input to the demand nodes and catchment node. The priority was given to the domestic demands, followed by agriculture and other demands. The preferences were assigned to the groundwater and surface water resources. The schematic of the WEAP model for IWMP-14 is shown in Figure 2.
The WEAP model formulation was completed and the first computation has been done by running the entire model for the reference scenario that is the default scenario generated using Current accounts for the time frame here (2011).
CALIBRATION AND VALIDATION OF THE WEAP MODEL
After setting up the WEAP model, calibration had to be undertaken to see the model is performing well for the given study area and simulating hydrologic processes are in a manner. The calibrated model can be used to explore the various development scenarios and their impacts on water availability. Here, the calibration was done by using the data for the current scenario and comparing WEAP output to the observed situation. The sensitivity analysis was also performed before calibration to determine the rate of change in model output to changes in model inputs (parameters). In the case of IWMP-14, effective precipitation was identified as the parameters to be modified during calibration. Model calibration was then followed by model validation to assess the performance of the model. The model performance was evaluated using Nash-Sutcliffe model efficiency coefficient (NSE) and R2, which were found in the acceptable range (above 0.65).
SCENARIO BUILDING
Using the calibrated model, various scenarios were generated to analyze the variation in demand patterns of the study area. The scenarios have been assumed to show the reflection of a condition that is likely to happen in the future as an outcome of watershed development activities undergoing in the area. These scenarios can also be used to foresee the effects of upcoming water stress which can be due to various factors like population growth, urbanization, over-dependency on the single water source.
Current accounts (2011) represent the basic definition of the water system as it currently exists. It is the base year for all scenarios. Starting with the reference scenario, the model is projected with changing demographics scenario, demand management strategies, variations in supply, etc. The results of these scenarios are reflected in the form of unmet water demand that shows the remainder of the demand that is not met at a particular demand site.
RESULTS AND DISCUSSION
Reference scenario
Under this scenario, the annual domestic water demand has been computed assuming the current practices to continue through the years from 2011 to 2030. It was seen that there won’t be any variation in the total annual demand, that is, 320ML (Population + Livestock), as the water use rate and supply had been kept constant. Now, out of this 320ML, 160ML is the unmet demand i.e., the water demand which has not been met. The demand site coverage is about 60%.
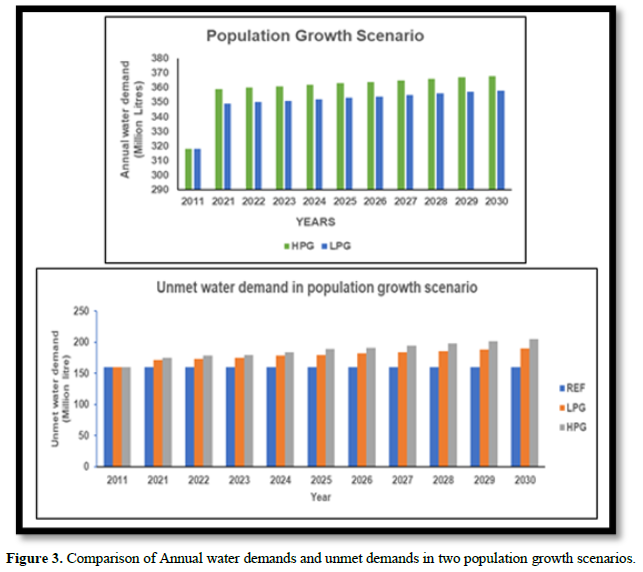
Scenario 1: Population growth scenario
Under this case, population growth is assumed to be projected over the watershed for both the population and livestock over the coming years, and the impact of the same has been analyzed over the annual water demand throughout 2021-2030. The two population growth scenarios viz., high population growth and low population growth were considered as sub-scenarios.
- High Population Growth (HPG)
The given scenario is generated to foresee the possible impact of high population growth on annual unmet water demand (Million Litres) if the population grows at an annual rate of 1.3% without any change in water use rate and supply as compared to the reference scenario. The results as in Figure 3 show that as compared to reference there is an increase in the total water demand from 320ML (2011) to 368ML (2030). Also, there is a considerable increase in the total unmet water demand from 160ML to 205ML by 2030.
- Low Population growth (LPG)
Since with the increase in education and awareness, it can also be assumed to have a low population growth scenario. It is assumed that the population grows at an annual rate of 1.0% The results show that as compared to reference there is an increase in the total annual water demand from 320ML (2011) to 358 ML (2030). It is noticed that although there is an increase in the unmet water demand (from 160ML to 190ML), the increment is comparatively lesser than the High population growth scenario.
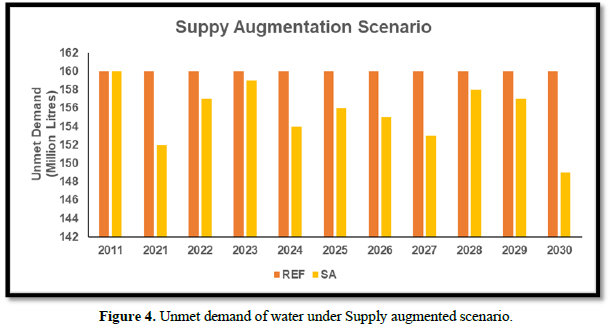
Scenario 2: Supply augmentation
In this scenario, changes in supplies are examined as a result of rooftop rainwater harvesting. In the Supply Augmentation scheme, it is assumed that 20% of households in the area, with an average rooftop area of 60sqm, began adopting rooftop rainwater harvesting beginning in 2021. As the number of houses grows with the population, the number of households adopting this supply augmentation strategy is assumed to increase in the same proportion. It is assumed that this strategy will be feasible in years of normal or above rainfall and only in the months, July to September when these months exceed 300 mm of rainfall. As a result of this projection, supplies are going to be more reliable in the coming years thereby decreasing the unmet water demand, especially from July to September as shown in Figure 4.
Scenario 3: Demand Management Scenario
In the demand management scenario, three sub-scenarios were developed viz., reducing distribution losses, increase in the rate of Percolation due to water conservation structures, and rural lake restoration.
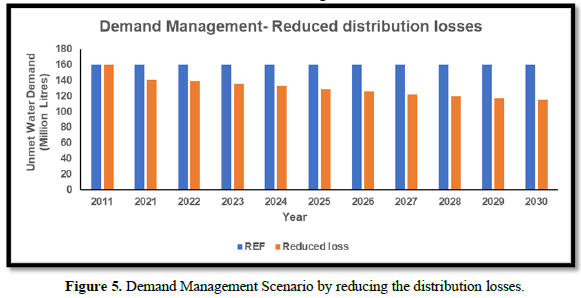
- Reducing the distribution losses
As per the studies available, current distribution losses in the water supply system due to leakage and lack of technological monitoring amounts to 20%. With the adoption of various infrastructure improvements, there can be a significant reduction of distribution losses in the system. In the Demand Management scenario, it is assumed that the Chhattisgarh state government will make serious efforts to reduce distribution losses in a phased manner. The proposed distribution losses in the model are assumed to reduce from 20% in 2011 to 10% in 2030 in the following manner: 2011 - 20%, 2021 - 18%, 2025 - 15%, and 2030 - 10%. The impact of which can be seen as the remarkable decrease in the values of unmet water demand as depicted in Figure 5.
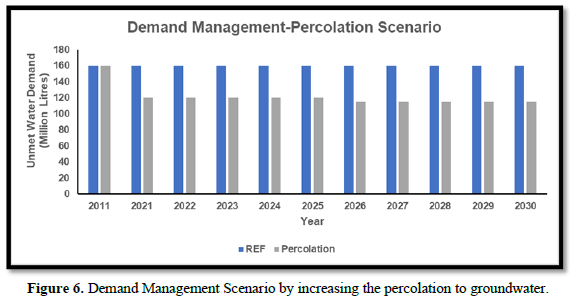
- Increase in the rate of Percolation due to water conservation structure
As per the reports on Chhattisgarh groundwater studies, it was expected to have an average increment of 0.8% by 2020s in the groundwater recharge after the successful implementation of the watershed development program which includes the construction of sunken ponds, gully trenches, water percolation ponds, etc. The effect of increased percolation on the water demand as compared with the reference scenario is shown in Figure 6. The results show that the average unmet water demand is going to decrease from 160ML to 115 ML
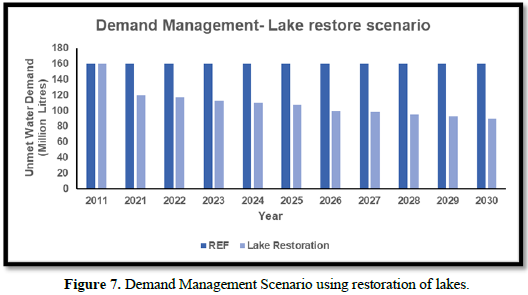
- Rural lake restoration
The major source of supply is the groundwater in the area which has led to a decrease in the level due to its over dependency. As per the Google earth and satellite images obtained, it has been seen that there are many ponds, tanks, and lakes present in the area but they are not functional as per the survey done in the area. In this scenario, it is assumed that gradually over time, lakes are also put into use and start contributing to meet the domestic demand. It is expected to supply 10% of the water demand from restored lakes and the unmet water demand is projected to gradually decrease from 160 ML to 93 ML, as shown in Figure 7.
Optimal water allocation plan of IWMP-14
The IWMP-14 micro watershed falls in the Kanker district of Chhattisgarh, India. The land use of the watershed is predominantly agriculture, which is mainly rainfed. Very few irrigation facilities are available from farm ponds and tube wells in the area. The Major Kharif crops include paddy, gram, kulthi, urad, and rabi crops include gram, peas, sunflower, and kulthi. The demands of the watershed can be divided into three major demands viz., Agriculture, population, and livestock. The water supply resources include rainfall, surface water (farm ponds, small streams), and groundwater (tube wells.). To optimize and allocate the available water resources, among different demands, three possible scenarios were run using a calibrated WEAP model for IWMP-14.
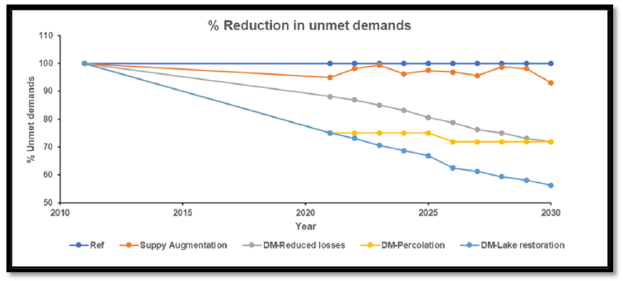
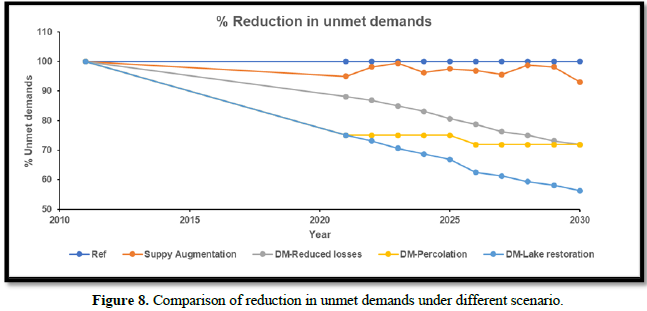
The scenarios considered for the analysis were Population Growth (Low and High), Supply augmentation, and demand management scenarios (Reduced distribution losses, increased percolation, and lake restoration). The unmet demands kept on increasing in the population growth scenario (Figure 3). The comparison of reduction in unmet demands in supply augmentation and demand management scenarios (Reduced distribution losses, increased percolation, and lake restoration) is shown in Figure 8. The reduction in unmet demand under the supply augmentation scenario will depend on rainfall received during a particular year, as we consider that monthly rainfall should be above 300mm. There is a remarkable comparison among three sub-scenarios of the demand management scenario. The reduced distribution losses showed a gradual decrease in the unmet water demands in IWMP-14. The success of the implementation of water conservation structures can be seen in the increased percolation scenario, where, a substantial decrease in unmet demands from 160 ML to 115ML was observed.
The most promising scenario to reduce the unmet demands is lake restoration. The area is blessed with several small lakes and ponds, of which storage capacity and usages have been decreased due to siltation, encroachment, and pollution. If local authorities and stakeholders take initiative to rejuvenate these water bodies, the water stress will be reduced in IWMP-14.
The demand-supply analysis was performed for the lake restoration scenario. It was seen that agriculture is a major demanding sector of the area, of which 75% of demands will be fulfilled by rainfall, 20% of demands by surface water, and the remaining 5% of demands by groundwater resources. The groundwater extraction for irrigation purposes can be reduced if, local water bodies are revived in the future. The population demands majorly depend on groundwater resources, about 10% of population demands will be fulfilled by surface water resources and the contribution of rainfall is negligible. The major livestock demands are fulfilled by ponds and small streams of the area. During the summer season, about 38% of livestock demands will be met by groundwater, and rainfall contribution is minimum. Overall, the sustainable water allocation plan can be achieved if the lake restoration scenario is implemented in the area.
CONCLUSION
As per the scenarios build for analyzing the demand pattern in the area, the effect of various factors on water demand and supply has been projected up to the year 2030. The factors are assumptions that are likely to happen and are important to consider while formulating policies for water allocation. The results are showing the trend of unmet water demand in the area over years as a result of which it can be seen that lake restoration shows the maximum coverage at all demand sites. Similarly, the effect of several other factors can be combined with the WEAP model to have a deep analysis in the formulation of optimum allocation policies. Firstly, the model was run to evaluate total annual water demand and unmet water demand for all the demand sites under the baseline scenario. The model then was run by changing population growth rates from low to high and variation in annual water use rates from 100lpcd to 120lpcd in the high growth rate and reducing it to 80lpcd in the low rates. In the consecutive scenario of supply augmentation, supply data is altered by introducing rooftop harvesting and adopting conjunctive use of groundwater and surface water. Urbanization effects are observed by reducing the natural recharge to an annual rate of 0.25 %. Demand management strategies are adopted in the form of reducing the distribution losses from 20% to 10% from the year 2011 to 2030 and increasing the water percolation rates at an annual growth of 0.8% due to the adoption of water conservation structures in the area. Rural lake restoration incorporates the development of surface sources in the area as lakes, ponds, tanks, etc, and using them to contribute to supply to domestic demand sites. It is assumed that at least 30% of the demand will be met by these restored lakes by the year 2030.
The present study attempts to show the impact of development and future water use on-demand variation. It can be seen that population growth is going to create water stress in the region if the current water supply is not altered. The unmet water demand increases by 20-30 million liters in this case as compared to the baseline scenario. The supply augmentation scenario shows the remarkable decrease in the unmet water demand in the initial years but with the increasing population growth, it can be less effective. So, it is to be adopted with the combined effect of low population growth rates. The demand management strategies including loss reduction in distribution lines show a decrease of 50 million liters followed by the adoption of water conservation structures that increases groundwater recharge, shows a decrease of up to 40 million liters each year in the annual unmet water demand. Rural lake restoration effects can also be noticed in the form of a decrease in the water stress although the decrease is small and gradual yet beneficial.
The study shows that with the adoption of the revival of water bodies, water conservation, and rooftop harvesting techniques, water stress can be reduced in the region in terms of meeting the domestic demand. The supply augmentation scenario shows promising results in increasing demand satisfaction. The demand coverage can be increased at all sites by diverting the water as per the requirement. However, the situation can get aggravated if the population continues to grow and dependency on usage is not shifted. Urbanization effects can increase the water stress to a higher level within a small period. So, it is recommended that water allocation policies need to consider the factors mentioned in the form of scenarios to have an optimum supply of water and overall watershed development.
- Bao C, He D (2015) The causal relationship between urbanization, economic growth and water use change in provincial China. Sustainability 7(12): 16076-16085.
- Saraswat C, Kumar P, Mishra BK (2016) Assessment of stormwater runoff management practices and governance under climate change and urbanization: An analysis of Bangkok, Hanoi and Tokyo. Environ Sci Policy 64: 101-117.
- Hong X, Guo S, Wang L, Yang G, Liu D, et al. (2016) Evaluating water supply risk in the middle and lower reaches of Hanjiang river basin based on an integrated optimal water resources allocation model. Water 8: 364.
- Oreskes N (2004) The scientific consensus on climate change. Science 306(5702): 1686-1686.
- Solomon S (2007) Climate Change 2007-The Physical Science Basis: Working Group I Contribution to the Fourth Assessment Report of the IPCC; Cambridge University Press: Cambridge, UK. Vol: 4.
- Sieber J (2009) WEAP: Water Evaluation and Planning system. Report published in Project and Tools. Accessed on: August 2, 2020. Available online at: https://www.sei.org/projects-and-tools/tools/weap/
- Un-GWP (2005) Un-Water and Global Water Partnership, Integrated Water Resources Management. Training Manual and Operational Guide. Canadian International Development Agency, CIDA, in the framework of the PAWD program, Partnership for African Waters Development.
- Agarwal S, Patil JP, Goyal VC, Singh A (2019) Assessment of water supply-demand using water evaluation and planning (WEAP) model for Ur River watershed, Madhya Pradesh, India. J Inst Eng (India): A 100(1): 21-32.
- Yates D, Sieber J, Purkey D, Huber-Lee A (2005) WEAP21 - a demand, priority, and preference-driven water planning model: part 1: Model characteristics. Water Int 30(4): 487-500.
- Yates D, Purkey D, Sieber J, Huber-Lee A, Galbraith H, et al. (2007) A physically based, water resource planning model of the Sacramento Basin, California USA. ASCE J Water Resour Plan Manag pp: 1-32.
- Mena D, Solera A, Restrepo L, Pimiento M, Cañón M, et al. (2021) An analysis of unmet water demand under climate change scenarios in the Gualí River Basin, Colombia, through the implementation of Hydro-BID and WEAP hydrological modeling tools. J Water Clim Change 12(1): 185-200.


QUICK LINKS
- SUBMIT MANUSCRIPT
- RECOMMEND THE JOURNAL
-
SUBSCRIBE FOR ALERTS
RELATED JOURNALS
- Proteomics and Bioinformatics (ISSN:2641-7561)
- Journal of Astronomy and Space Research
- Journal of Womens Health and Safety Research (ISSN:2577-1388)
- Journal of Genetics and Cell Biology (ISSN:2639-3360)
- Journal of Veterinary and Marine Sciences (ISSN: 2689-7830)
- Advances in Nanomedicine and Nanotechnology Research (ISSN: 2688-5476)
- Journal of Genomic Medicine and Pharmacogenomics (ISSN:2474-4670)


