
3868
Views & Citations2868
Likes & Shares
The research paper dives into the knowledge of existing migration reports and trends happening around the world and how it can affect an economy by looking into facts and figures of past study and making a study to understand that for an economy to grow, more focus should be given to migration as well and certain qualitative factors should also be accountable for it. With this study, the government should also have knowledge that migration plays a key role in improving and uplifting the economy of a country. To conclude, we study the parameters of net migration with the migrant stocks of the world and calculate using quantitative data for qualitative factors.
According to The International Migration Report, 2017, the number of international migrants worldwide has continued to grow rapidly in recent years, reaching 256 million in 2017. The report also gives information about which country was the largest country of origin of the migrants, which was India, and giving the demographic breakup of how many migrants are male, female, young, old, etc. But this all data is only useful for the calculation of net migration and that too for different-different regions. It gives out important key data to understand the current trends of migration of the world and with this knowledge we further proceed with the research we are doing. Only data for the net migration is available while the migrant stock around the world is missing under this report. We make use of the data found with the migrant stock around the world to further elaborate our study. We are looking for the growth of the economy of the destination country while this report gives us the general overview of all the migration happening around the world with demographic segmentation which helped as a base for this research to go forward.
Another article through which this research is based on debates on the fact that whether migration is good or bad for the economy. It states that the migrants fill important niches in both fast-growing and declining sectors of the economy, young-migrants are better educated than those nearing retirement, also that they contribute more in taxes and social contributions and they have the most positive impact on the public purse. The main points to glance from this article was that the economic growth effect of migration. They boosted the working-age population, arrive with skills and contribute to human capital development and contribute to technological progress. But the study was only limited to these specific countries and as such the sample was small. There are more countries with varying other possible effects from migration that affect them. This debate proved what we seek but it was restricted only to specific countries and not to a continent or region as a whole and taking it to the world scale where there would be a higher migration rate and higher migration stock and movement between them would be the highest while the economic effects are not yet explored about them.
Now the question arises is that, what impact does it have on the economic growth of the countries that the migrants migrated to? The answer to the question is very broad and to answer it we need to look for the international migration stock of the world across various different continents, identify the continent where there is the highest migrant stock and observer which all countries are destination countries and lastly identify the factors that cause the migrants to migrate.
LITERATURE REVIEW
Migration has existed since the beginning of mankind. It is understood as a permanent change in the residence of an individual from their place of origin to their place of destination. Over the years we have seen a huge rise in migration all over the world. It has been grown from 220 million in 2010 to 258 million in 2017 (United Nations, 2017). The data is so vast and empirical that it shows all the migrants’ data of how they go from one place to another and which all countries are the most popular places of migration which attracts them. The demographic segmentation helps us to identify which all age categories and genders usually migrate and are more motivated to travel to.
Mostly young generation people tend to migrate more and often than the older generation (OECD, 2014). They tend to have more innovative ideas to contribute to work and tend to work much harder than the native old people of the country. The migrants contribute more in taxes and social contributions than they receive in individual benefits. They contribute more to the public purse of the country and make important contributions in both low and high skilled occupations. This is restricted only to the European countries and no qualitative data had been given in the past research. The how people migrate had been answered but the why had been untapped and no such qualitative research had been done on a large scale.
One such paper written by Naveed Farah emphasized on the qualitative data of the small district of Faisalabad in Pakistan (Naveed Farah, 2012). The prevailing major factors were lack of education facilities, bad healthcare facilities and prevailing war conditions rising which force the people to migrate out of the country to seek better quality of life and live a comfortable and safe lifestyle. But one such research gap could be found is that it is not applicable for all the countries as different countries can have different factors for migrants to migrate to other countries and it is sadly limited to only Pakistan.
Staying with Pakistan and around that region, there has been observed a vast increase in the net migration rate of the Asia and Pacific region (United Nations, 2017). We see a large factor of poverty to be the major driver of migration and various economic, demographic and political drivers. There are also some environmental factors which affect the migration rate within a region. One such major findings from this paper has been found is that it dives into the illegal migration factors that happens around this specific region. Factors like trafficking and smuggling of migrants have been researched about how they occur. Only missing facts is that rest of the world migration happens in a different way.
The factors of the rest of the world are very vast and big and namely they are all categorized in 3 categories namely, Economic, Social and Political (Urbanski Mariusz, 2022). These factors have been collectively named as the Push and Pull factors and consider of the behaviour of the migrants to them. This research had been reserved to only Poland and Romania and as such we have seen another such factor like bad hospital facilities seen in the district of Faisalabad, Pakistan (Naveed Farah, 2012). and as such so general factors could be stated for all the countries in the world. The qualitative factors are ever changing and very variable in nature and very different for each and every country. But no relationship has been stated with the growing economy of countries and the rise in migration rate of regions or continents. There are possibilities of getting a relationship of using the migration data and economic growth of the highest region to get the result.
Objectives
- To identify international migrant stocks across the continents.
- To identify the destination countries within that continent having highest international migrant stocks.
- Identify the factors that causes people to migrate to those countries.
Data Sources
All the data has been taken from the World Bank Data site to get Net Migration, Growth Rate, Migration Stock, Gross Capital Formation and Political Stability.
METHODOLOGY
Using statistical tools like graphs and percentage wise distribution of the world data to segregate the data to elaborate better. Using correlation to ascertain the relationship between net migration and growth rate of the world and continent selected.
International Migrant stocks across the continents.
Let us focus on first objective hand which is to identify and club all the countries of the world into different continents. Clubbing of the countries into continents instead of regions is to get the data more accurately and see the trends of the continents of the migrant stock whether they rise or fall. Looking at the data we can club into 5 continents namely a) Africa b) Asia & Pacific c) Europe d) North America and e) South America. Antarctica is not included because no such data is available for the continent and the countries. Let us look at the data of the continents and analyze.
It is divided by continents and discussions all about them with a conclusion at the end of the trend in the world with reference to the past discussions. It will be like this:
- Africa
- Asia & Pacific
- Europe
- North America
- South America
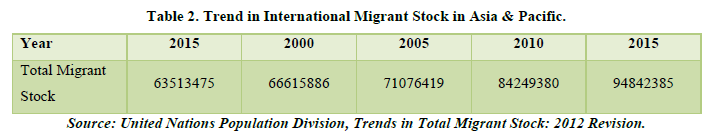
Africa (Table 1 & Figure 1)
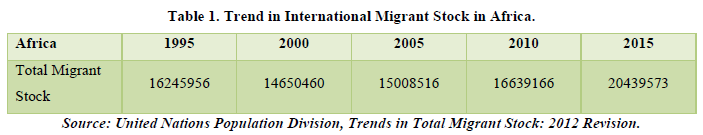
Africa is the world’s second-largest and second-most populous continent. It is located in the eastern and northern hemispheres and is bordered by the Mediterranean Sea to the north, the Atlantic Ocean to the west, and the Indian Ocean to the east. It is home to 54 countries, each with its unique history, culture and language. Africa has a diverse and rich landscape, including deserts, mountains, savannas, rainforests, and coastlines, and it is home to a vast array of wildlife. Despite the continent’s many challenges, such as poverty, disease, and political instability, Africa is a land of opportunity and a storehouse of natural resources, with enormous potential for growth and development. The current population of Africa is 1.46 billion.
Looking at the chart we see that there is a positive trend of the migrant stock as noted by the trend line. The data ascertains that an average of 2.16% growth is there in the migrant stock of Africa from the time period of 1995-2015. Most of the countries are below the trend line suggesting the people usually tend to migrate out of the continent rather than coming in the continent for migration opportunities and better living standards. As stated above Africa as a continent is rich in natural resources and abundant landscapes but is prone to poverty, diseases and political instability which means that education is not adequate, less job opportunities, distrust among people and social unrest could be also another issue all together. But the data shows a positive growth which is good for the continent but not as much as the other continents in the world. There are some countries like Cote d’Ivoire and South Africa which prosper with high migrant stocks but there are other countries like Lesotho which struggle for high migrants.
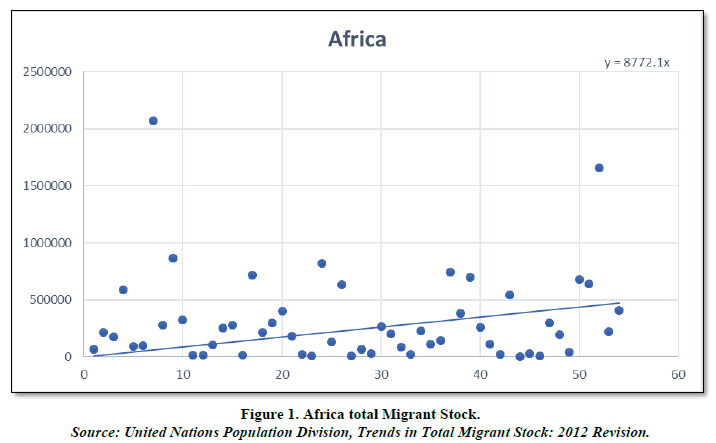
Asia & Pacific (Table 2 & Figure 2)
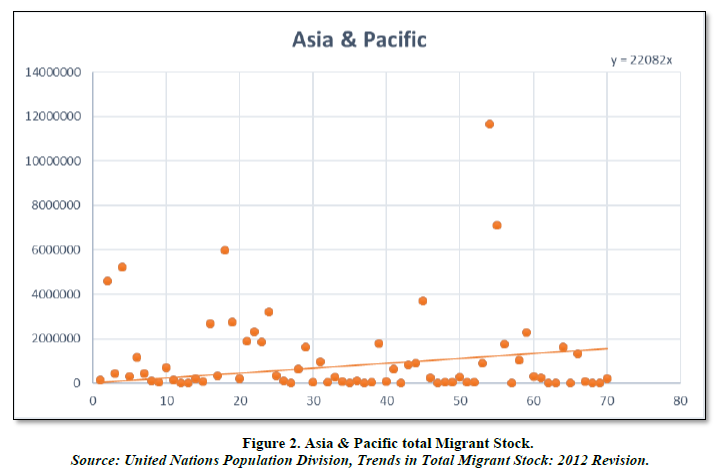
Asia & Pacific is the world’s largest geographic region, covering a vast area that spans from the western shore of the Mediterranean Sea to the Pacific Ocean. It includes the continents of Asia and Australia, as well as numerous island groups such as the Philippines, Indonesia and Papua New Guinea. With over 4.4 billion people, Asia & Pacific is also the most populous region in the world, making up roughly 60% of the world’s population. The region is home to diverse cultures, languages and religions, and is known for its rich history, as well as its economic and technological advancements in recent years. There are 70 countries in the region.
Looking at the chart we can see an exponential positive trend of the migrant stocks in this region. The highest being the Russian Federation with around 1.2 billion migrant stock. There are abundant resources as well as opportunities for migrants to migrate to these countries. Majority of the countries are above the trend line ascertaining the fact that these particular countries are the destination countries of the migrants while the countries below the trend line signify that these countries might be the source of people where they migrate from. They seek better lifestyle outside of their home countries and this region has the highest prospect for them. It is due to the fact there is a huge population and many companies invest for cheap labour as well as access to vast resources and better growth incentives for them. Here the constant average growth of the migrant stock is around 19.75%.
Europe (Table 3 & Figure 3)
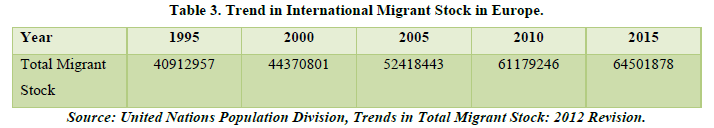
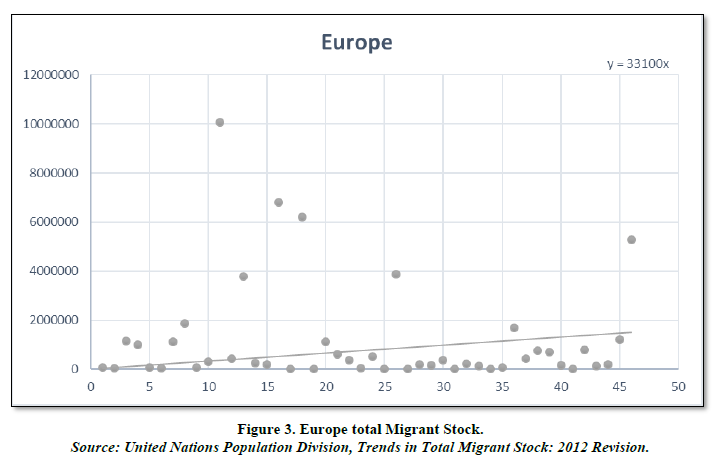
Europe is a continent located in the northern hemisphere, covering an area of approximately 10.18 million square kilometers. It is the second smallest continent in terms of size but it the third most populated continent with an estimated population of over 743 million people. It has a long and rich history that dates back to ancient civilizations, including Greeks and Romans. It is home to 46 independent countries with each having their unique history, language and culture. Each country fosters its own identity and has contributed to global art, literature, music, fashion and cuisine. Overall, Europe remains a vital center for trade, tourism and cultural development, and continues to play a crucial role in global affairs.
Looking at the chart we can identify that there is definitely a positive trend of the migrant stock in the continent but only a handful of countries are above the trend line with the highest country being Germany having about 10 million migrant stocks of the world. This is much higher than Africa but less than Asia and Pacific countries. Europe has a high average growth rate being 28.75%. This is due to that fact there is a diverse economy with each and every country having its own individual image in the world. And also access to advanced education, technology and also a rich cultural heritage. This makes an ideal place for migrants to migrate to as Europe is a hub of every global affair and there are abundant opportunities here. Many companies and industries are originated from here. For example, Germany is known for its motor car industry and the company originated from here is BMW. France for its cuisines and fashion industry and many such countries can be stated as there is no exhaustive list for this continent.
North America (Table 4 & Figure 4)
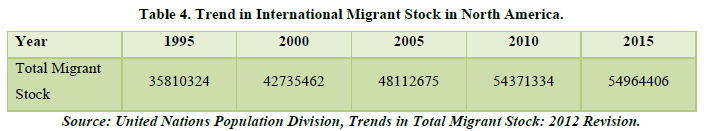
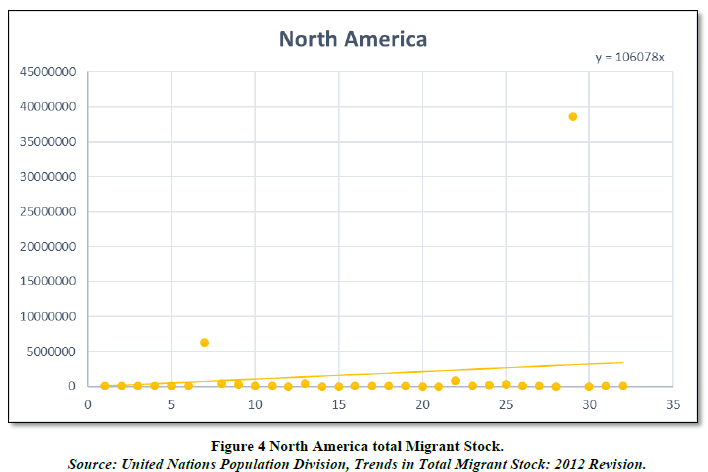
North America is a continent located in the northern hemisphere of the Earth, home to 32 countries. It is the third-largest continent by area. It is bordered by the Arctic Ocean to the north, the Atlantic Ocean to the east, the Pacific Ocean to the west, and South America to the south. It boasts a variety of landscapes, including vast plains, towering mountain ranges, dense forests, and expansive deserts. It is also known for its diverse cultures, languages, and ethnic groups, with a rich history and a vibrant contemporary landscape. The economies of North America are some of the world’s most powerful, thanks to the region’s wealth of natural resources, technology and innovation.
The chart shows a positive trend of the migrant stock rising throughout. But only 2 countries are above the trend line which is United States of America and Canada. Here in this region only 2 lucrative countries are there for the migrants to migrate to rest all the countries people tend to migrate out of. Another matter of fact is that most of the countries are scattered into islands or not close to the mainland. Only the mainland countries attract the migrants for good amenities like transport, homes, infrastructure, etc. Canada is the leading country for world renowned medical facilities and good job opportunities. The most sought out country for migrants in Canada and majority of Indians tend to migrate there only. Over the past years, there is 31.8% increase in the migrant stock in this region which is a very good sign. But, we can’t take this continent for our study as the sample size is very small and could not give an accurate representation of our study. Only about 32 countries are there by which only 2 are above the trend line, which would give no such good results to our study.
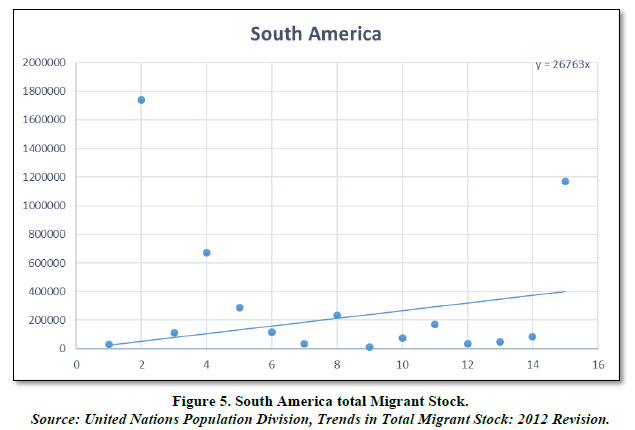
South America (Table 5 & Figure 5)
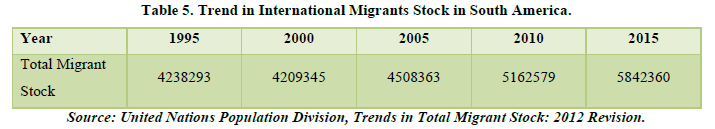
South America is the fourth largest continent on Earth, covering an area of 17.8 million square kilometers. It consists of 12 sovereign countries and 3 territories, and it is home to over 420 million people. It is bordered by the Pacific Ocean to the west, the Atlantic Ocean to the east, and the Caribbean Sea to the north. It has a rich history and culture, with indigenous civilizations dating back thousands of years. The Spanish and Portuguese colonized much of the continent in the 16th and 17th centuries, leaving a lasting impact on its language, religion and traditions. In terms of economy, South America is rich in natural resources such as oil, gas, minerals and agricultural products. It is also home to major cities like Sao Paulo, Buenos Aires, Rio de Janeiro and Lima, which are hubs of commerce, culture and tourism. Overall, it is a unique and fascinating continent, offering various visitors a chance to explore diverse landscapes, vibrant cultures and rich history.
By analyzing the chart, we can see that there is a positive trend of the migrant stock in the continent. As the continent holds about 12 countries and 3 territories, it is the smallest continent having such less countries. Only about 6 countries are above the trend line indicating that there is a positive effect on the migrants coming into the continent for migration and better living but a vast number of countries are below the trend line suggesting that people like to migrate of the continent. It may be due to the factors of poverty, bad healthcare facilities, less education, etc. Looking at Brazil, there seems to be a positive indication that people migrate to the country but majority of people live in slums called favelas. Overall, there seems to be a rise of the migrant stock of about only 2.16% over the past years. Coming the lowest with Africa.
World Analysis (Figures 6 & 7)
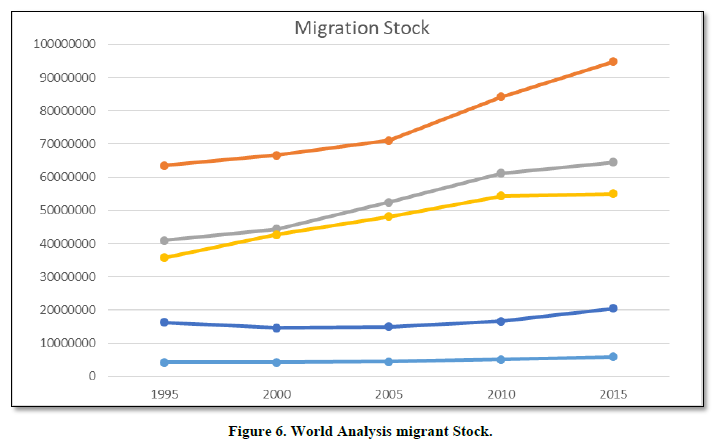
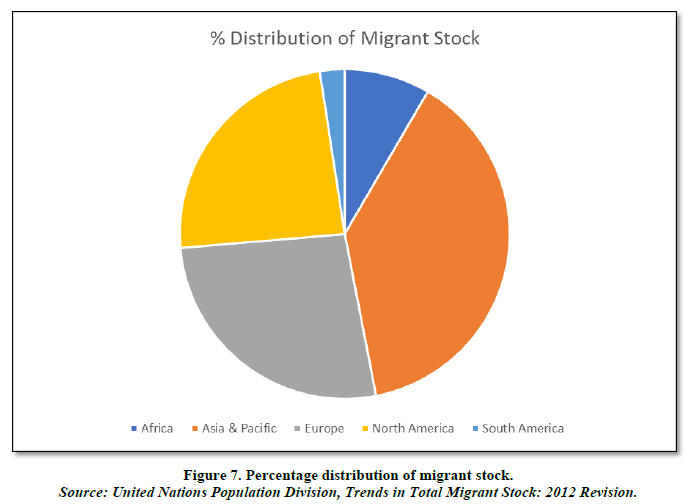
By analyzing both the charts we see that Asia & Pacific region having the highest migrant stocks compared to the whole world. It starts at about 60 million and goes up to 95 million in the chart. There is an exponential rise from the period of 2005-2020 so, we will take this period as our time to examine for our study and taking this region for further analysis.
Identifying Destination Countries
Now that we have identified the continent where the highest number of migrant stocks reside, we would now identify the destination countries where the migrants go to. For this we need the Net Migration data of the Asia & Pacific region. By this we would see where there is a positive number of migrations happening overall. The Table 6 below shows the Net Migration Data.
Table 6. Net Migration Data.
|
Country |
Total |
|
Afghanistan |
-86399 |
|
Armenia |
-448069 |
|
Australia |
3373481 |
|
Azerbaijan |
81638 |
|
Bahrain |
323317 |
|
Bangladesh |
-7622667 |
|
Bhutan |
-8092 |
|
Brunei Darussalam |
111 |
|
Cambodia |
-608477 |
|
China |
-4197637 |
|
Cyprus |
123218 |
|
Fiji |
-159783 |
|
French Polynesia |
-24436 |
|
Georgia |
-325801 |
|
Guam |
-32500 |
|
Hong Kong SAR, China |
223981 |
|
India |
-6816557 |
|
Indonesia |
-978236 |
|
Iran, Islamic Rep. |
2018377 |
|
Iraq |
138360 |
|
Israel |
193303 |
|
Japan |
2414462 |
|
Jordan |
2546675 |
|
Kazakhstan |
13183 |
|
Kiribati |
-10437 |
|
Korea, Dem. People's Rep. |
-47420 |
|
Korea, Rep. |
1765948 |
|
Kuwait |
1235948 |
|
Kyrgyz Republic |
-548716 |
|
Lao PDR |
-329084 |
|
Lebanon |
-96680 |
|
Macao SAR, China |
141693 |
|
Malaysia |
2131287 |
|
Maldives |
116690 |
|
Marshall Islands |
-28556 |
|
Micronesia, Fed. Sts. |
-30792 |
|
Mongolia |
-21040 |
|
Myanmar |
-1863600 |
|
Nauru |
-2130 |
|
Nepal |
-3326746 |
|
New Caledonia |
-2419 |
|
New Zealand |
495143 |
|
Northern Mariana Islands |
-33493 |
|
Oman |
956879 |
|
Pacific island small states |
-358260 |
|
Pakistan |
-18716733 |
|
Palau |
-2754 |
|
Papua New Guinea |
580796 |
|
Philippines |
-1939406 |
|
Qatar |
1595300 |
|
Russian Federation |
5184857 |
|
Samoa |
-48502 |
|
Saudi Arabia |
3004237 |
|
Singapore |
1253347 |
|
Solomon Islands |
-31855 |
|
Sri Lanka |
-998855 |
|
Syrian Arab Republic |
-3777079 |
|
Tajikistan |
-371041 |
|
Thailand |
930837 |
|
Timor-Leste |
-48685 |
|
Tonga |
-33057 |
|
Turkiye |
1225389 |
|
Turkmenistan |
-147373 |
|
Tuvalu |
-886 |
|
United Arab Emirates |
3849138 |
|
Uzbekistan |
-508756 |
|
Vanuatu |
-9508 |
|
Vietnam |
-560346 |
|
West Bank and Gaza |
-389185 |
|
Yemen, Rep. |
-563919 |
Source: United Nations Population Division. World Population Prospects: 2022 Revision.
Looking at the data above we can see that there are many countries with positive and negative figures. The positive figures indicate that there is positive migration in that country or they can be identified as destination countries where migrants tend to migrate to. The negative figures indicate that there is a negative migration or they can be identified as the origin countries where migrants come from. The leading countries of origin are China, India, Bangladesh and Pakistan to name a few. With this data we can take some particular countries where net migration is high and analyze them further for our study. The countries chosen for the study are:
- Australia
- Japan
- Korea Republic
- Malaysia
- New Zealand
- Qatar
- Singapore
- Russian Federation
- Thailand
- Saudi Arabia
Factors affecting migrants to migrate
Before we go towards the analysis, we should first identify the factors which affect the migrants to migrate to the countries and the factors chosen to elaborate the study.
As stated, multiple times before, people migrate for better living standards, better education, good infrastructure, job opportunities, etc. But what gain do the migrants give to the destination country? Or better iterated, what factors affect the destination countries by migration. Let us see the factors that we will use in our study.
Gross Capital Formation
It was formerly known as gross domestic investment. It consists of outlays on additions of the fixed assets of the economy plus net changes in the level of inventories. Fixed assets include land improvements, plant, machinery, equipment purchases, construction of roads, railways, etc. Inventories are the stocks of goods held by firms to meet temporary or unexpected fluctuations in production or sales and “work in progress”.
Growth Rate
Growth Rate has been calculated as Gross Domestic Product (GDP) expressed in current international dollars converted by Purchasing Power Parity (PPP) conversion factor. GDP is the sum of gross value added by all resident producers in the country plus any product taxes and minus any subsidies not included in the value of the products. PPP conversion factor is a spatial price deflator and currency converter that eliminates the effects of the differences in price levels between countries.
Political Stability and Absence of Violence/Terrorism
It measures perceptions of the likelihood of political instability and/or politically-motivated violence, including terrorism. Estimate gives the country’s score on the aggregate indicator, in units of a standard normal distribution.
All these factors will help us to identify any such relationship between Net migration and analyze them.
Observations
With all the data at hand and the countries selected we move onto analyzing the data and getting to a conclusion whether there is a relationship between Net Migration and the factors we have chosen. For this purpose, we apply correlation in our study (Tables 7 & 8).
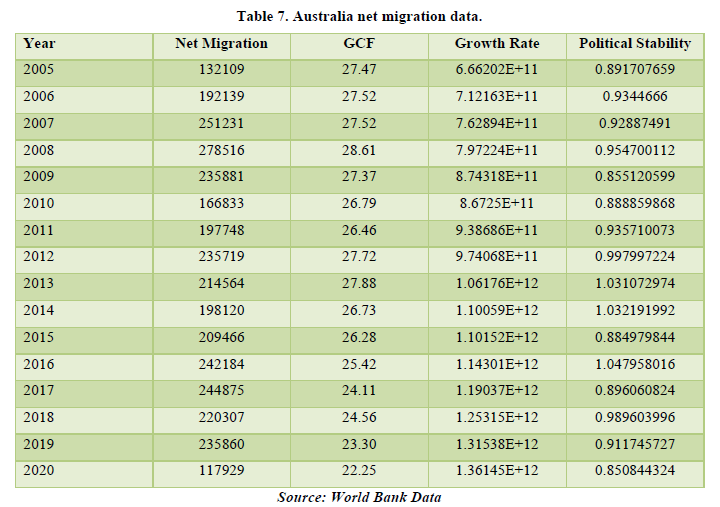
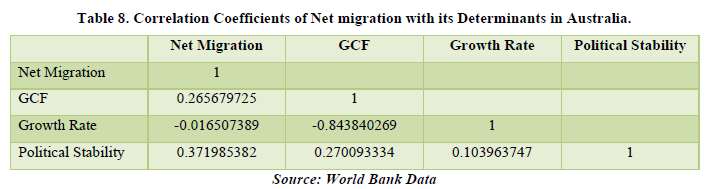
As we can see from the data, over the past years there has been a positive migration rate in the country of Australia. Looking at the correlation (Table 7). We see that Net Migration is affecting the GCF and Political Stability of the country. This means that there must be increase in fixed assets (land, building, machinery, etc.) and causing some instability in the political sphere. The percentages are 26.56% for GCF and 37.19% for Political Stability. Hence, we can conclude that Net Migration affects the economy of the country of Australia. Besides Net Migration, Political Stability is getting affected by both GCF and Growth Rate of the country but only by a small margin. This means that as higher and higher growth rate and GCF rises, proportionate growth is there in Political Stability. For the country of Australia, the major factor which changes with rise in migration is Political Stability (Table 8).
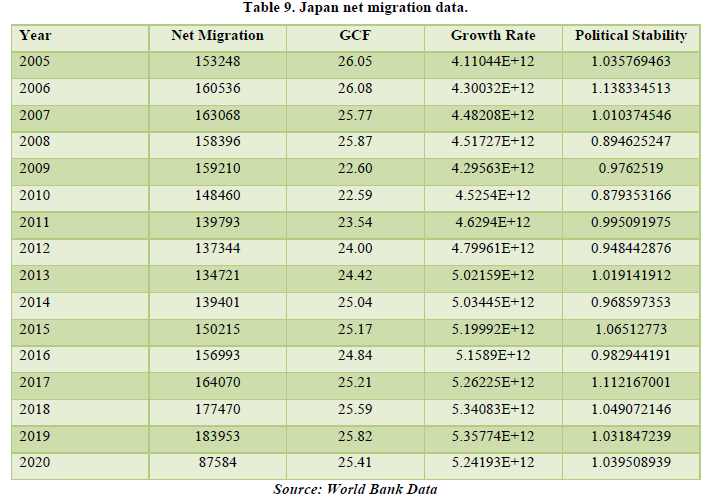
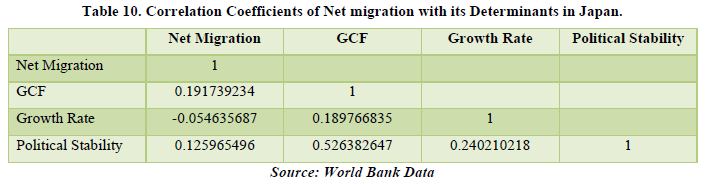
Looking at the data for Japan we also see the similar trend of overall positive net migration over the years indicating that it has been a destination country from the beginning. The correlation table shows that Net migration is related with only GCF and Political Stability by 19.17% and 12.59% respectively. Besides that, GCF and Growth Rate are also related by about 18.97% but the most common among all factors is the Political Stability with about 52.63% with GCF the highest among all the factors. This means with the increase in the fixed assets and inventories of the country there will be rising change in policies relating to the industrialization in the country. But for our study we see only Net Migration which is only related by a little amount. The factors are related to Net Migration but only by a small amount (Tables 9 & 10).
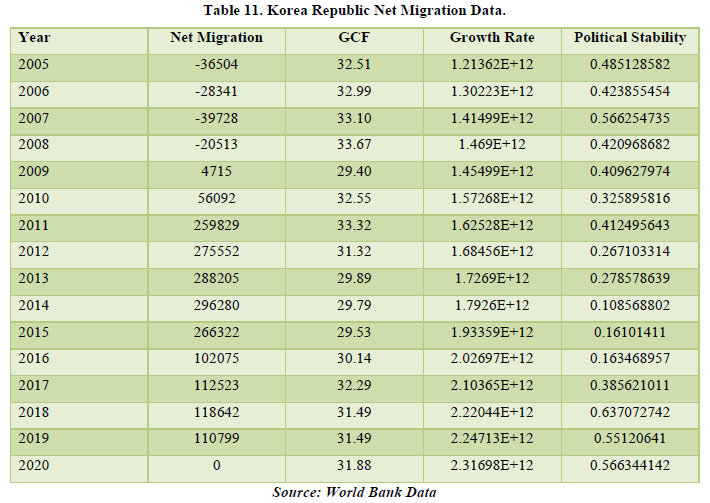
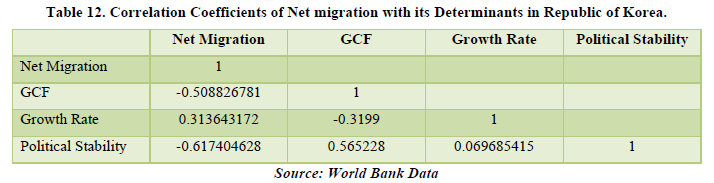
The data for Korea Republic shows a negative figure from the period of 2005-2008, meaning people used to migrate out of the country in that period and it was a country of origin. But due to technological advancements and development, it became a destination country for the migrants. By correlating, we only get that Net Migration is related with only Growth Rate of the country which was calculated as per capita GDP on PPP basis, relating only by 31.36%. This means that migrants were able to contribute towards the economy and they had ample purchasing power to do so. In this case, Net Migration is affecting the economy of the country. Other factors related are Political Stability with GCF and Growth Rate. It means that the country’s focus for changing policies and growth was for the rising growth rate by 69.68% and increase in investments for infrastructure by 56.52% (Tables 11 & 12).
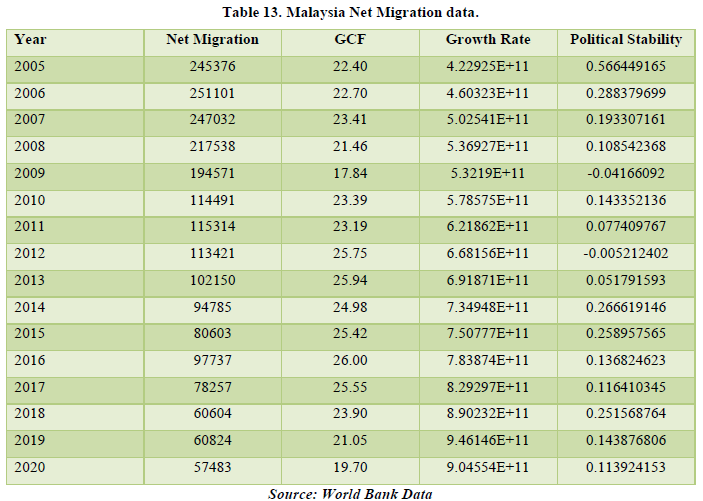
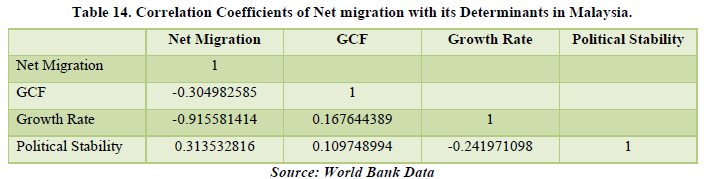
The data of Malaysia for Net Migration is declining year by year. From 245,376 in 2005 to 57,483 in 2020. That is a decline of about 76.57%. Net Migration only affected the Political Stability of the country by 31.35% meaning some changes in policies were inflicted by migration in the country. Only GCF is getting affected by the Growth Rate and Political Stability in the country only by very little amount. This is not relevant for our study. For the country of Malaysia, the declining rate of migration, despite the government’s efforts for keeping the migrants in the country, it might become a country of origin rather than being a country of destination for the migrants. But at-least, Net Migration affects the economy of the country thorough Political Stability (Tables 13 & 14).
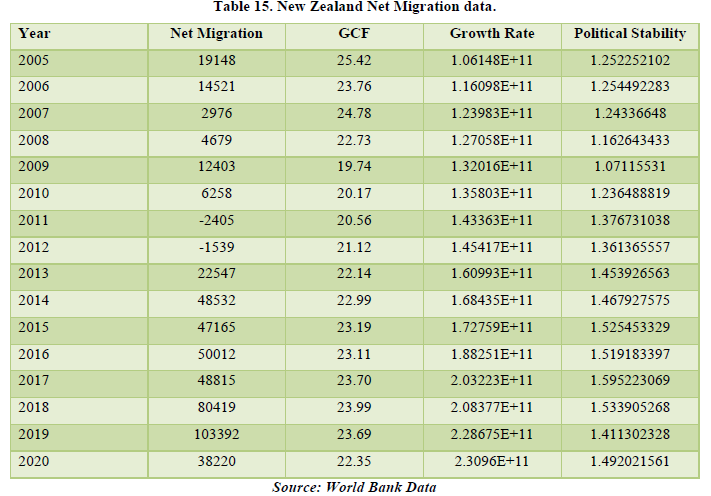
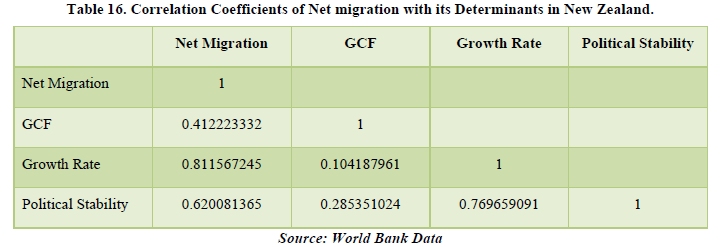
The data for the Net Migration in New Zealand shows a positive figure overall meaning it is a destination country of the world in the Asia & Pacific region. Seeing the correlation table, we see that Net Migration affects all the 3 factors which is GCF, Growth Rate and Political Stability by 41.22%, 81.15% and 62% respectively. All the factors are at a high percentage which means that Net Migration affects the economy of New Zealand by a huge margin. The highest being Growth Rate means that more people buying and offering products and services more the economic growth of the country (Tables 15 & 16).
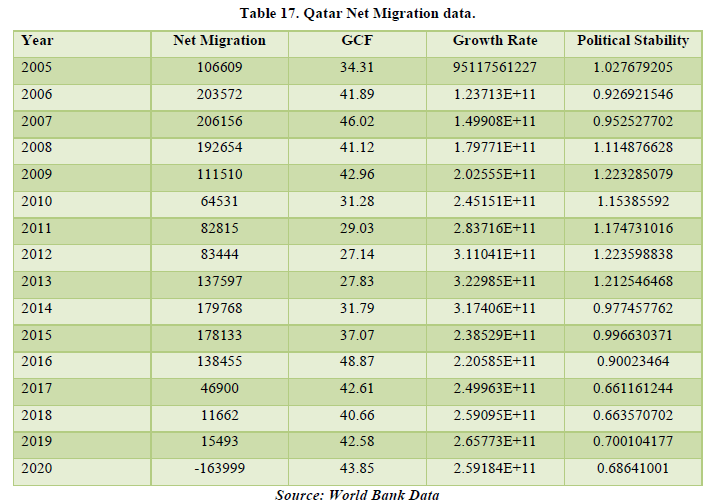
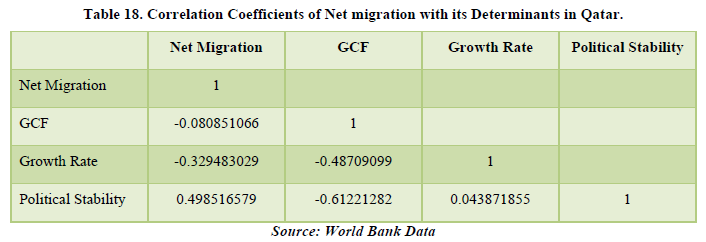
The data shows a positive net migration for the past years but in 2020, the data is showing a negative figure which means that people moved out of Qatar. The major reason being the global pandemic. The net migration is only affecting the political stability of the country by about 49.85% which means that there must be some improvements in policies for the migrants to stay or might be some resistance due to some policies. Only by this factor, net migration is affecting the economy of Qatar (Tables 17 & 18).
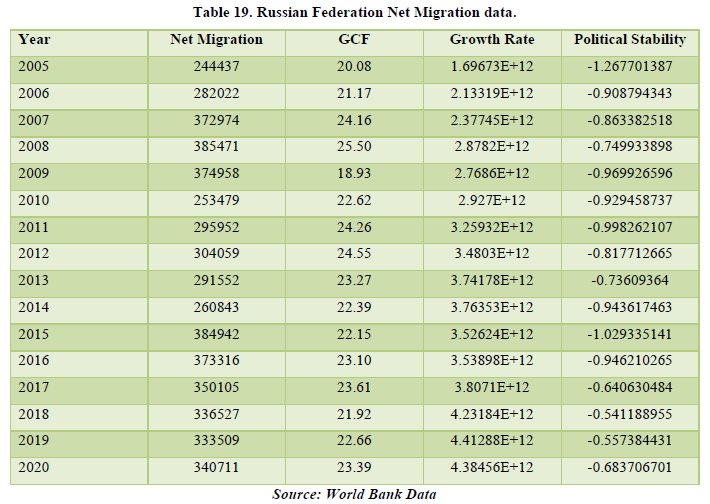
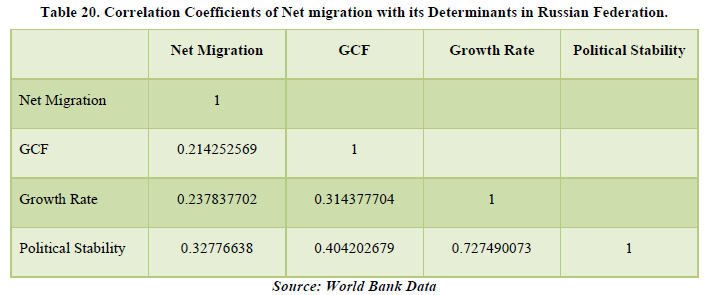
The overall data of Russian Federation shows a positive figure for net migration meaning it is a prominent destination country for migration. The correlation table shows a relationship between net migration with GCF, Growth Rate and Political Stability by 21.42%, 23.78% and 32.77% respectively. The most net migration is affecting is the political stability of the country meaning more changes in the government policies and changes overall for the betterment of the migrants. Overall, net migration is affecting the economy of the country by all 3 factors of Russian Federation. The major other factor affecting the country is the Growth Rate and political stability with their relation being 72.74% (Tables 19 & 20).
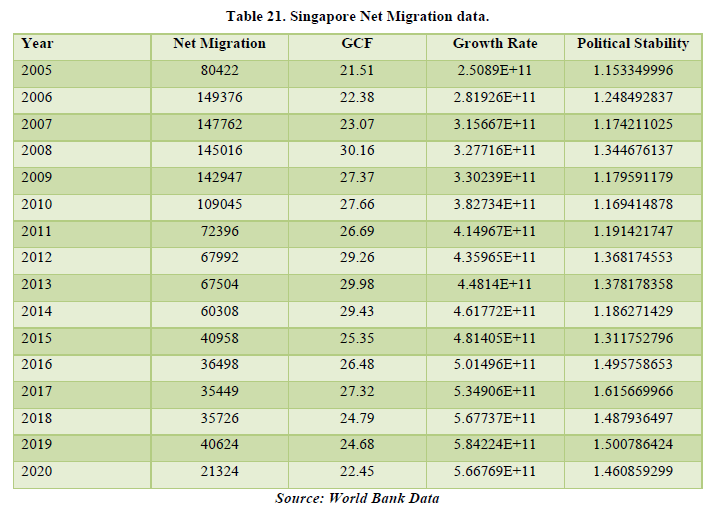
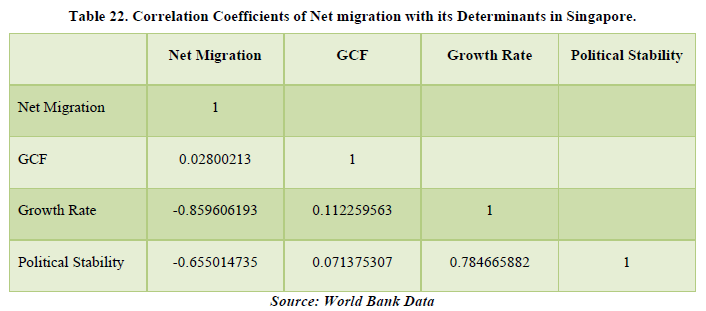
The data of Singapore shows a positive net migration over the years but it has been declining. The lowest being 21,234 in 2020. The major reason for 2020 is the global pandemic but for the past years there could be other reasons unknown. The correlation tab shows that net migration is affecting GCF of Singapore only by a meagre 2.8% which is pretty much in-significant for our study. So, we can conclude in the case of Singapore, net migration is not affecting the economy of the country. The factors which are related with each other in the country are growth rate with political stability by 78.46% (Tables 21 & 22).
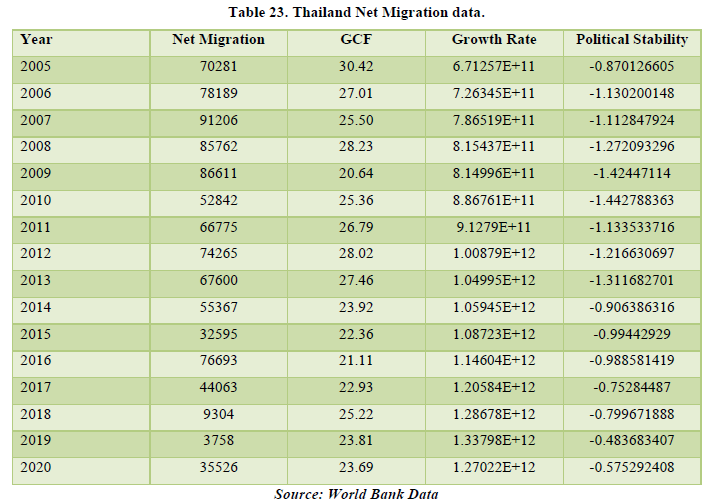
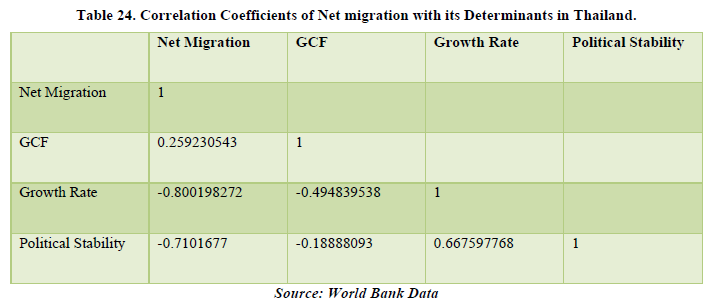
Looking at the data of Thailand, it shows a positive net migration that shows that it is a destination country. The correlation table shows the relationship between net migration and GCF of 25.92%. This means that with the advancements in infrastructure and improvements of industrialization, migration has a role in the growth of them. This means that migration is affecting the economy of Thailand. Besides net migration, Growth Rate is also affecting the Political Stability of the country by about 66.75% (Tables 23 & 24).
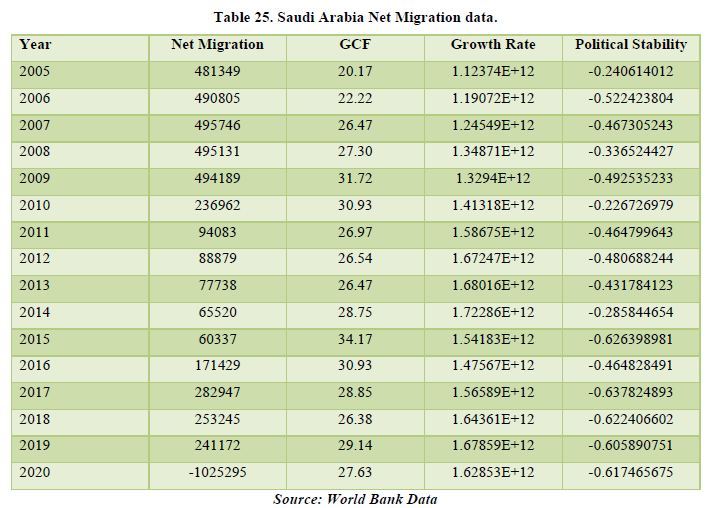
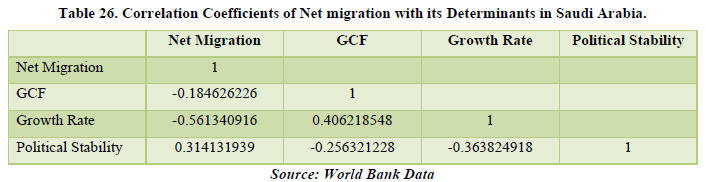
Looking at the data of Saudi Arabia, we see positive net migration over the years but with one year having a negative figure that being 2020. It may lead to reasons like job layoffs, no job openings due to the pandemic and migrants and native people too moving out if the country in the time. The correlation table shows a relationship between net migration and political stability of the country by 31.41%. It means that the government’s actions and policies are being affected by the migration of people in the country. Hence, migration is affecting the economy of Saudi Arabia (Table 25 & 26).
CONCLUSION
With all the findings and discussions above, we see that migration is affecting each and every country by one or more factors in the economy. Except for the case of Singapore, all the countries are getting affected by migration one way or another. An average of about 26.86% of net migration is affecting the Gross Capital Formation of the countries selected which are related with that factor in the above study. Now talking about the relationship between net migration and growth rate in the economy of the countries, it is getting affected with an average of about 45.43%. It shows that migration is affecting the growth rate of the countries by a good margin and with that the economy too. Moving to the relationship between net migration and political stability, we see an average of about 36.74% which shows that migration affects the political affairs of the country too. With about this high of an average, it is safe to say that migration has a key role in affecting the economy relating to political matters, its decisions, actions and policies.
Overall, with our findings we see that migration has a key role in the economy of the countries of the world and it can affect the factors of it immensely. So, countries should focus more on allowing migration to occur in their country as it can immensely boost up their economy and also bring in new ideas, new technology as well as a new way to look into problems and as such develop and advance the country with the passage of time. Hence, migration affects the economy of the country.
LIMITATIONS
The data for Migrant Stock for the year 2020 was not available due to the frequency the data is collected which is by 5 years of gap and 2020 being the pandemic year, the data could not be found.
Various other factors still remain to be not found for the reasons of the migrants moving in or out of the country.
The data for Political Stability takes the general focus of only the absence of violence as the factor.
-
 Table 1
 -
Table 2
-
Table 3
-
Table 4
-
Table 5
-
Table 6
-
Table 7
-
Table 8
-
Table 9
-
Table 10
-
Table 11
-
Table 12
-
Table 13
-
Table 14
-
Table 15
-
Table 16
-
Table 17
-
Table 18
-
Table 19
-
Table 20


