
8517
Views & Citations7517
Likes & Shares
Data collection was conducted by working closely with restaurant management to access the respondents, sample, issue questionnaires and collect after filling.
FINDINGS AND DISCUSSION
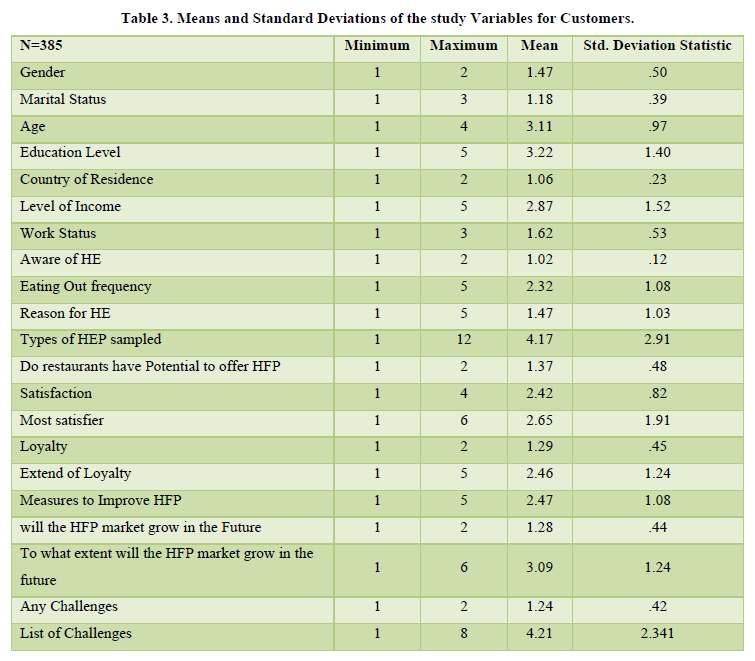
Demographic and socioeconomic data collected from the study were; age, gender, residence, education/professional qualification, career status and level of income (Table 2). Demographic characteristics such as age, gender and residence were computed to establish their percentage proportions as well as their significance in predicting the health food product market growth. Socio-economic characteristics were similarly computed for percentage proportions of each as well as their significance in market growth. Significance has been used to establish significance whereby any figure less than α ≥ = 0.05 was found to be significant. More data on customers showing mean and standard deviation for all variables in the customers’ questionnaires are presented in Table 3.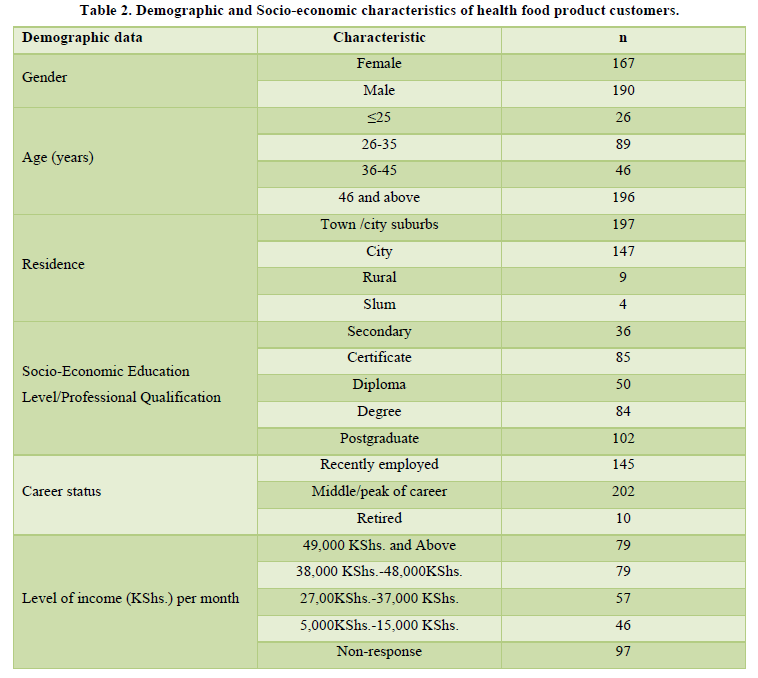
Effect of Demographic and Socio-economic Factors on Growth of the Health Food Product Market
Age of Customers as a Factor in Market Growth
One of the factors that the study found to be significant (p = 0.00) in the growth of the health food product market was age. The highest number of customers sampling health food products were aged 46 years and above, followed by ages 26-35years, 36-45 years and customers aged 25 years and then below. These findings show that majority of people who use health food products are old (46 years and above) (54.90%). This is because they are cautious about what they eat due to the fear of health lapses or ailments associated with advancing age. Indeed, Xiao Zhou, Perez-Cueto, Dos Santos et al, (2018) argues that could achieve a better quality of life if they made diet-related changes by receiving either dietary education or healthier meal service. This age bracket is mostly composed of those who are at the peak of their careers and retirees (56.50% and retirees (2.80%). Their choice of healthy food is not by default. This is because it suddenly dawns on them that healthy food will elongate their lifespan hence the need for selective eating. This group of people has made various investments such as in education for their children and would like to live longer to see the returns of their work. This cadre of healthy eating product customers is also settled in their families and is getting returns from their investments and retirement. Perhaps the WHO, (2017) was right when in its findings, raised its concern about the rise of lifestyle diseases in Africa. In their study findings, statistics of these silent killers entailed 10% cardiovascular diseases, 4% cancer, 3% respiratory diseases, 4% diabetes, 70% nutritional diseases while 5% accounted for other chronic diseases. Apparently, as one ages, the ailments take a toll and a healthy lifestyle presents an opportunity for preventive and management approach.
It is also notable that health food product customers aged 26-35 use these products more than those aged 36-45 years. Several factors account for this. First, the 26-35 year olds are recently employed and recently married. This implies that their incomes are not burdened at all. This group of people is also adventurous and eager in sourcing information more than the 36-45-year-olds. Healthy food for this category of people was trendy and it conformed to their social group aspirations. On the other hand, the 36-45-year-old (which was also the mean age at 3.11) customers scored less than the foregoing group due to several possible reasons: their financial incomes could be committed in terms of paying school fees for their children, servicing mortgages and loans-issues which make it difficult for them to choose specialized foods such as the healthy food products. The customers in the 25 years and below age bracket were the worst represented in sampling health food products. Other than general ignorance associated with this age group, it could also be that they want to enjoy their life to the fullest. Selecting foods unnecessarily interferes with their freedom of choice. Secondly, this category of customers may not have the necessary financial income to enable them to sample this cadre of foods. Most of them are still dependent on their parents, guardians and sponsors and are still in colleges or schools where the sampling of foods is limited.
Galiciano et al., (2016) aver that most people who seek healthy food products in eating outlets are older and more informed about food products and their impact on health. Circumstances and times, however, change as more young people (26-35years at 24.90%) are sampling health food products than older ages (36-46 years at 12.90%) as shown in Table 3.
Gender and Growth of the Health Food Product Market
Gender was an important attribute among staff in health food catering outlets as well as customers. The findings of the study show that most heads of department were male (55%) followed by females (45%). The representation of customers by gender, on the other hand, was also male followed by female (Table 3).
The low representation of females in the position of head of the department was attributed to the hostile nature of hotel work that is characterized by long working hours. Most females would not, therefore, remain in the profession long enough to be promoted to the position of head of the department. UNCTAD, (2010) argues that women employees in eating outlets in Kenya are underrepresented. Salih, (2015) on his part, reported that there was a smaller number of women in the hospitality and tourism industry. According to Salih, the under-representation of women in the hospitality industry in developing countries was because of cultural reasons where women’s role in such societies was mothering, behind the scenes or only slotted for back-of-the-house work. The higher number of males (53.20%) who ate out is attributed to Africa’s patriarchal setting that has favored males against females (46.70%) from time immemorial (Salih, 2015). The findings present a difference of 10 % between the two genders.
Hwang & Lorenzen, (2012) concur with the study findings that more males ate out compared to females. According to their findings, there was a 10% difference between the genders. This could be because males had freedoms of choice and movement compared to females. This means that males easily access education and dominate in employment, a factor which gives them a higher representation in eating out. Moreover, the African culture is highly restrictive on what its women should eat or not eat and confines them to homes to cook for their families and take care of children. A woman who eats away in restaurants or hotels is expected to be accompanied by her husband or else she is regarded as of questionable morals. It does not matter whether the woman is employed or not. It is also possible that most men who ate out did so because their wives were in employment and could not be readily available to cook for them at home (Salih, 2015).
The fewer women who ate out could be attributed to a new wave of the feminist movement in Nairobi that agitates for equal rights for both men and women. Other factors such as the promulgation of the new constitution in 2010, the Forum for African Women Educationalists (FAWE), sensitization conferences, seminars and even the school and colleges curricula have gone a long way in elevating the status of the womenfolk against cultural barriers in Kenya (UNICTAD, 2010). Salih, (2015) states that developing countries have more males in employment than females. He argues that this is attributed to cultural practices that favor men concerning education and employment. This means that the likelihood of more men eating out in restaurants as well as using healthy food products is higher than that of women. This difference in eating out trends between females and males is not by default but in the African culture that presents more opportunities to men in terms of education, employment, and freedom to be away from the home among other freedoms.
Since more men have formal education due to cultural advantage then it is possible that they easily access information on healthy food habits. Indeed, access to information gives food users a better opportunity in making informed decisions on food choices about human health whenever they eat out. Josiam & Foster, (2012) and Lone et al., (2012) argue that males were less interested in nutritional information than female customers in eating outlets. The preceding findings contradict the study findings (Josiam & Foster, 2012; Lone et al., 2012). If men were less interested in nutritional information than females, then why were males more highly represented than females? The explanation for this phenomenon could be that the study targeted specialty restaurants. Based on the fact that more males generally ate out, then, it is understandable, that these proportions would be reflected in the gender representation.
Galiciano, et al., (2016) on their part, however, state that there were no significant differences between males and females when it came to sampling health food products in eating outlets. The findings of these earlier studies could be attributed to the cultural contexts and the dynamics therein regarding gender power relations (Salih, 2015). Most developed countries, for instance, have commendably reduced the disparities between their males and females with the latter realizing equal opportunities and representation in education, employment and in other social institutions (UNICTAD, 2010).
Education Qualification and Market Growth
Education qualification was identified as a significant factor in the growth of the health food product market. Findings show that the education qualifications of health food product customers (p-value 0.00) were significant in market growth. Findings from customers show that majority of them had a postgraduate level of education followed by customers with bachelor’s degrees. Customers with a certificate level of education came in the third position followed by diploma, and lastly, customers with a secondary level of education.
Restaurants guests with bachelor’s degrees and above form the largest proportion compared to those of diploma, certificate and form four levels of education combined. High proportions of customers with bachelor’s degrees and above who sampled health food products were because high levels of education meant not only high income but also higher access to information on healthy eating. Moreover, people who have high access to information about health, nutrition and the effect of their food choices on human health are also in touch with international eating out practices/trends which had lately been shifting towards healthy food choices. Again, degree holders and above had a higher income that would enable them to select and consume healthy food products. This was because healthy food products cost comparatively higher in Nairobi restaurants.
The lower proportion of customers with form four levels of education meant that they had low salaries and as such, most of them did not consume healthy food products in the Nairobi restaurants. The low number of form four education level customers might also have resulted from stereotypes attached to eating places in terms of their prices and the social classes of people who patronize them. It is, however, noticed that health food product customers with a certificate level of education were more than those with a diploma level of education. This could be because certificate holders are in most cases young, newly employed and with fewer commitments compared to diploma levels of education that may be older with more financial commitments.
Although age has no relationship with education level, the Kenyan situation is different. Most Kenyans who did not directly qualify to enroll for a bachelor's degree, take the alternative routes of certificate, diploma then degree, or start working as untrained and enroll later. This means that by the time they attain higher education levels, they would have advanced in age. The study findings did not however rule out the relationship between age and education level of health food product customers. Based on the findings that most (54.9%) of the sampled customers were aged 46 years and above and that the highest proportion of customers (28.5%) had a post-graduate qualification, the study finds the two variables-age and education level related. Stubenitsky et al., (2014) argue that people with higher levels of education have higher access to information concerning eating habits and their health implications. Other research findings show that previous customers selected healthier menu choices using nutritional information menu labels (Angel & Silver, 2011; Galliciano et al. 2016). This means that ability to read and write is an important determinant of healthy eating and according to this study, age is also a factor.
This study however finds that although high education levels could predict the likelihood of customers sampling health food products, customers with lower education levels but with more disposable income also sample health food products in large numbers. This implies that although education level was an important factor in selecting healthy food choices while eating out, financial status was also important.
Residence of Health Food Product Customers and Market Growth
Findings of the study show that the residence of health food product customers was a significant (p≤0.05) factor in the growth of the health food product market. Most of the respondents resided in city suburbs followed by city, rural and, lastly, slum areas. Most of the health food product customers thus stayed in the city suburbs (town) and the city. This was deducted from the questionnaire choices that respondents selected. The choices of residence of customers included the city, city suburbs (town), rural area and any other location. This was because most employment opportunities are in urban areas. Again, working status in addition to income, access to education, and information about health, nutrition and human health are factors which increased the likelihood of restaurant goers sampling health food products in Nairobi City County. The low proportion of customers from rural and slum does not, however, imply that high proportions of people from rural and slum areas do not consume healthy food products. Mutai, (2011) argues that most people who eat out live in urban areas. The study does not, however, indicate whether such people are health food product customers.
Career Status of Health Food Product Customers versus their age and Market Growth
Career status of health food product customers was found to be significant (p≤0.05) in the growth of the health food product market. The working status of health food product customers shows that most of the health food product customers were in the middle of their working career, followed by those who had been recently employed and, finally, customers who had retired. The findings indicate that most of the health food product customers are in some employment. The high representation of health food product customers who were in the middle of their careers was because most of them were at the optimum level of their careers and could be almost at the highest position in their jobs. This translated to high-income levels which enabled them to adopt and sustain a healthy eating perspective. According to the findings in table 4.4, 26-35 years of age among customers sampled for the study came second ( 24.90%) after 46 years and above (54.90%) in terms of age. This trend could be related to career status where most of the sampled customers were in the middle of their career (56.50%) followed by those who had been recently employed (40.70%). This, therefore, implies that 46 years and above (54.90%) could be connected to customers who were in the middle of their careers (56.50%) while 26-35 years of age applied to 24.90%). Salih, (2015) avers that there is a relationship between age and professional qualification and career status among hotel goers.
The higher proportion of health food product customers who were in employment could also be attributed to the location of the study. Apart from travellers, most people who live in Nairobi City County and its suburbs and ate in the expensive (Picture 4) health food product restaurants were engaged in some employment. This was the only way they could meet the ever-rising cost of living within the city and its environs. Stubenitsky et al., (2014) argue that education, level of income and professional qualification influence peoples’ food habits. Mutai, (2011) agrees that most people who eat out are in some kind of employment.
Implication of the Level of Income among Customers on Market Growth
To establish whether a relationship existed between the level of income among health food product customers and market growth, a null hypothesis was set. The hypothesis set was that there is no significant relationship between the level of income among health food product customers and market growth.
The study, however, found that level of income has a significant (p≤0.05) influence on the growth of the health-eating product market. It was established that the income of health food product customers ranged from KShs. 5,000 to more than KShs. 49,000 per month.
The largest proportion of health food product customers earned KSh.49, 000 and above per month, followed by customers earning between KSh. 16,000 and KSh. 26,000 per month. The high proportion of health food product customers-who earned KShs. 49,000 and above-was because this category of customers was older, more educated and therefore, had high access to information about food choices and their effect on human health. Customers who earn between KShs. 16,000 and KShs. 26,000 came second. The high proportion of this category of customers was because they were young, newly employed and with fewer commitments. This was also because the group is adventurous and keen on trends and fashion.
The third largest category was customers who earned between KShs. 27,000 and KShs.37, 000 Kenya shillings. The low representation of this category of customers was because they were married with young families and therefore with more financial commitments. They, therefore, had little resources left to select what to eat. This was also the category with children in expensive academies and at the same time servicing loans and other financial obligations.
There was more representation of health food customers with an income level of between KShs. 38,000 and KShs. 48,000. The high proportion of this income category was because they were settled in their careers and were also receiving returns on their investment and therefore had a higher bargaining power and could select what to eat.
Customers who earn KShs. 5,000 - KShs. 15,000 had a lower (12.90%) representation. The low representation was because of their low economic status. It could also be attributed to their low academic levels and unstable or low-paying jobs. Salih (2015) argues that people with low academic levels are mostly placed in semi-skilled and unskilled jobs which have low pay hence their low social status. The low academic and economic status of this category of customers, therefore, made it difficult for them to select these foods in expensive Nairobi city restaurants.
SUMMARY OF FINDINGS
The study found that majority of customers who sampled health food products were Male (53.2%) aged 46 years and above (54.9%), residing in either town/city suburbs (55.2%) followed by city (41.2%).
Professional level indicate that the customers were mostly (56%) in the middle/peak of their employment or recently employed (40%).
Demographic and socio-economic characteristics that were significant in the market growth of this cadre of products are: age (p=0.000), gender (p=0.000), Education level (p=0.000), residence (p=0.05), careers status (p=0.05) and level of income (0.05).
IMPLICATIONS OF THE STUDY FINDINGS
Findings from this study form a basis for product development, market segmentation, targeting, destination branding as well forecasting. The study findings are also a useful insight into the health food and wellness market.
-
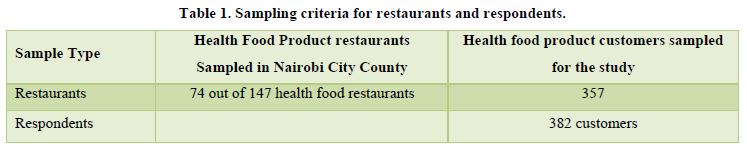
 Table 1
 -
Table 2
-
Table 3


