
4828
Views & Citations3828
Likes & Shares
METHODOLOGY
Quantitative and qualitative techniques were used on the diversified population comprising university students, International Students Linkages and Collaborations (ISLCs) and community based tourism organizations (CBTOs) (Onwuegbuzie, Leech and Tahtinen, 2016). The non-probability purposive/deliberate sampling technique (Finlay, 2014)) was used to select the universities (CUE, 2014). Disproportionate stratified random sampling was used to select the international students because they had different sampling fractions and had low variations within the sub-groups (Singh, 2015).
The sample size was calculated using (Yammane, 1967) = N/(1+N(0.05)2)
The typed and printed structured questionnaire with both closed and open-ended questions were constructed in advance and then used to collect data from the students in the universities. Personal interviews were administered face to face to gather information from heads of the international Linkages and collaboration programs in the selected universities in Nairobi and its environs. To acquire information from the Community Based Organizations (CBTOs), a focus group discussion schedule was developed. The bibliographical review was carried out to explore studies that had been carried out by other scholars concerning the same area of study. The Cronbach alpha coefficient design was used to measure internal consistency (Cronbach, 1951). The rule of (George & Mallery, 2003) was followed and alpha coefficients of >0.7 were accepted (Cronbach, 1951).
RESULTS
The study findings on Table 1 revealed that most 60.2% (199) of the scholars preferred university accommodation from other accommodation types.
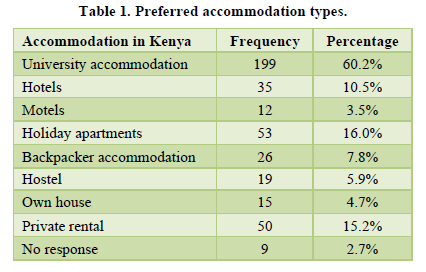
Table 2 indicates that 50% scholars agree and strongly agree that places of accommodation were clean and convenient, safe, easy to book and gave value for money at mean values 3.7, 3.6, 3.5, 3.4 and 3.3 consecutively.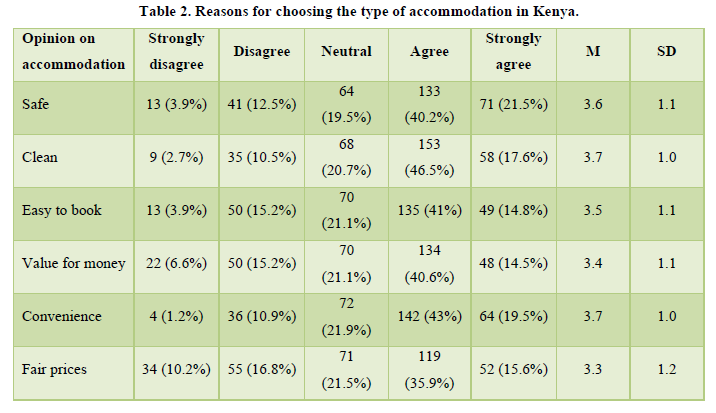
An interview with the International Students Linkages & Collaborations (ISLCs) on where the students reside while in the institutions affirmed that indeed few of the students were accommodated within the campus while other students lived in private hostels off-campus while others preferred to rent private houses in the residential estates convenient to them.
The results on Table 3 show the factor analysis - rotated component matrix on the reasons for choosing Kenya as an educational tourist destination.
Seven strong variables in component 1 and seven strong variables in component 2 were identified with eigen values equal to or greater than 1. The strong variables in component 1 include personal safety and security 0.793 unspoiled and conserved natures 0.774, ease of reaching a destination 0.773, both climate conditions and the quality of accommodation 0.693, biodiversity 0.582 and availability of transportation services 0.573. The strong variables in component 2 include nightlife and entertainment 0.807, shopping possibilities 0.803, the offer of local cuisine 0.675, sports and recreation facilities 0.541 and the local people’s friendliness at 0.520.
Table 4 shows Pearson chi-Square tests carried out on type of accommodation and monthly income before tax and after tax. This was to ascertain the type of accommodation preferred most by the international students while in Kenya.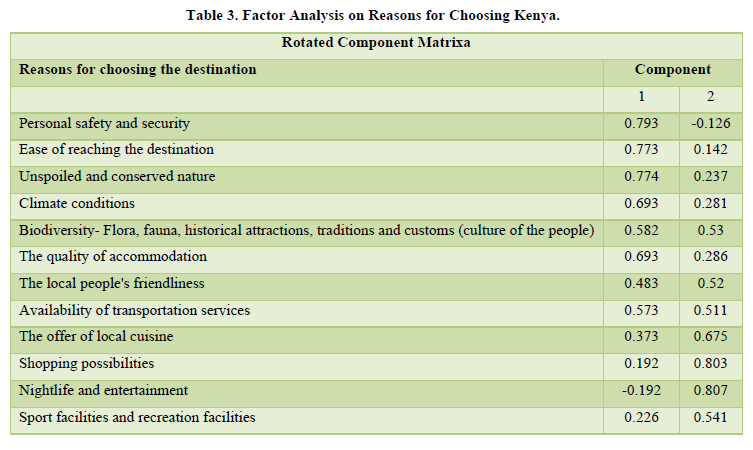
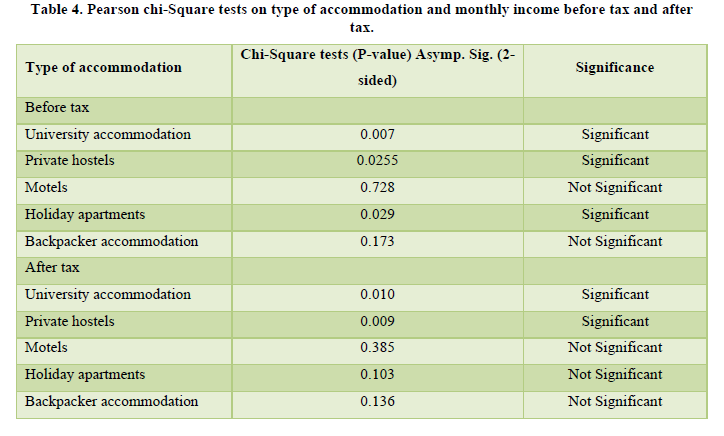
The result findings indicate that the most preferred accommodation types by the respondents before tax with P0.05 as follows; motels 0.728 and backpacker accommodation 0.173. The types of accommodations preferred after tax with P0.05 as follows; motels 0.385, holiday apartments 0.385 and backpacker accommodation 0.136 Chi-square tests were carried out on consumer behavior factors and sustainable tourism development as shown on Table 5.
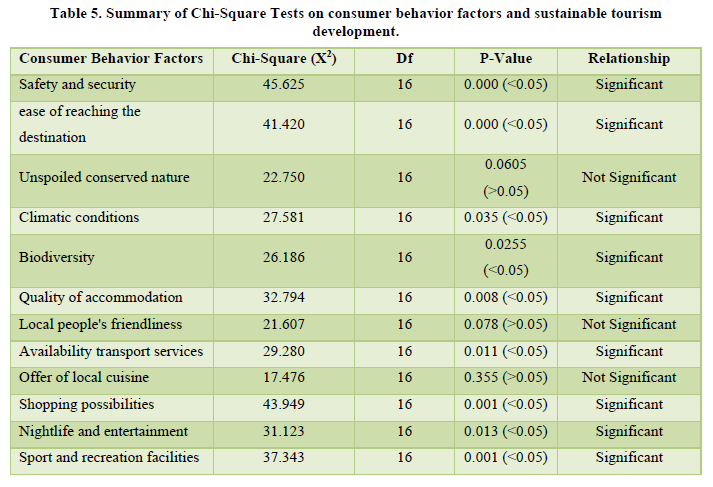
Table 5 shows Chi-square analysis that was used in testing the significance of the relationships between variables. The factors of consumer behavior, an independent variable were cross tabulated against the dependent variable sustainable tourism development.
There was a significant relationship between personal safety and security an element of consumer behavior and sustainable development as indicated by P-value=0.000 (P-value<0.05). International students are likely to suffer violence of one form or another (Marginson, Nyland, Sawir & Forbes Mewett, 2010) (Polsjski, 2011). When ease of reaching the destination an element of consumer behavior and sustainable development were cross-tabulated it resulted to P-value=0.000 (P-value<0.05) which indicates significant relationship. Most of the roads in Africa are seasonal and impassable (IMF, 2016) (Vision 2030, 2014).
Chi-square analysis yielded P-value=0.035 (P-value<0.05) which indicated that there was a significant relationship between unspoiled and conserved nature an element of consumer behavior and sustainable development. Kenya’s ecosystems are endowed with unique plants and animals (Grigolon, 2012). Consequently P-value=0.0255 (P-value<0.05) which indicates a significant relationship was realized between biodiversity an element of consumer behavior and sustainable development. Scholars prefer authentic ecosystems (Lyons, 2012). When it came to climatic conditions against sustainable tourism development the p=0.035 (P<0.05) which indicated a significant relationship. Weather pattern changes affect tourism (IMF, 2016) (Vision 2030, 2014). There was a P-value=0.008 (P-value<0.05) which indicated a significant relationship between the quality of accommodation an element of consumer behavior and sustainable development. There is limited accommodation in Kenya’s universities (Capital Campus, 2017; UoN, 2014).
There was no significant relationship between local people's friendliness an element of consumer behavior and sustainable tourism development as indicated by P-value=0.078 (P-value>0.05).
According to Devine, (Baum & Hearns, 2009) the host community needs to be hospitable and knowledgeable of tourism practices. The relationship between availability of transportation services an element of consumer behavior and sustainable development was significant as shown by P-value=0.011 (P-value<0.05). Transportation by road and air in Kenya need improvement as opined by (World Bank, 2013; MEACT, 2016). There was no significant relationship between the offer of local cuisine an element of consumer behavior and sustainable tourism development as indicated by P-value=0.355 (P-value>0.05). Other visitors may indulge in the foods from menus of the host communities (Gnoth, 1997; Cohen, 1979; Cohen, 1972).When shopping possibilities an element of consumer behavior was cross-tabulated with sustainable development P-value=0.001 (P-value<0.05) which indicates significant relationship was realized. Students who had extra income spend sumptuously (Macclnnis, Priester & Park, 2009). There was a significant relationship between nightlife and entertainment an element of consumer behavior and sustainable development indicated by P-value=0.013 (P-value<0.05). Educational tourists want to escape from routine programnes (Aliyeva, 2015). When sport and recreation facilities an element of consumer behavior and sustainable development were cross-tabulated it yielded P-value=0. 001 (P-value<0.05) which indicates a significant relationship between them.
Symmetric Measures on three consumer behavior variables and sustainable tourism development
Three consumer behavior variables were not significant since P>0.05 and further tests were performed as shown on Table 6. The Chi-Square tests (χ2) carried out between Unspoiled and conserved nature and sustainable tourism development it resulted to χ2 =0.121, the local people’s friendliness yielded χ2 =0.156 whereas the offer of local cuisine led to χ2 =0.355.
Symmetric tests of Kendall's tau-b (TB), Spearman Correlation (rs), Pearson's R (r) were further carried out on the three independent variables that were not significant with Chi-Square tests. Unspoiled and conserved nature when measured against sustainable tourism development it yielded; TB 0.125, rs 0.115, r 0.126 all of which P>0.05 and therefore it proved not to be significant. Educational tourists did not consider the factor to affect sustainable tourism development and was not important. The local people's friendliness yielded TB 0.008, rs 0.007, r 0.19 and the offer of local cuisine yielded TB 0.039, rs 0.035, r 0.23. The two variables had impacts on sustainable tourism development and were significant with P<0.05.

DISCUSSIONS
Cross tabulation between reasons for choosing Kenya and sustainable tourism development
The factor concerning unspoiled and conserved nature was not considered by 53.7% (43) international students as having an impact on sustainable tourism development. 54.3% (64) of the students that feel that the ease of reaching a destination is very important agree to a large extent on the impact. 57.9% (44) that sustainable tourism development was indeed affected by climatic conditions. 50% (37) of the foreign students felt that biodiversity was very important agree to a large extent on the impact. 51.1% (46) that feel that shopping possibilities is important agree to a large extent that consumer behavior have impact on sustainable tourism development. 52.5% (52) of the international students felt that nightlife and entertainment was important agreed to a large extent that consumer behavior has an impact on sustainable tourism development while 56.6% (30) of the students that felt that nightlife and entertainment was very important agreed to a large extent on the impact. 44.4% (44) and 39.2% (31) of the students felt that nightlife and entertainment an attribute of consumer behavior to a large extent was important and very important as an impact on sustainable tourism development.
Cross tabulation between type of accommodation and demographic factors
University accommodation and private hostels were preferred most by the students as indicated by p values of 0.014 and 0.032 respectively (P<0.05). The level of education denote that only one variable, university accommodation was determined by level of education. The other four factors signify that the level of education did not ascertain the type of accommodation; private hostels P-0.081, motels 0.22, holiday apartments 0.3135 and backpacker accommodation 0.1825.
Cross tabulation between quality of accommodation and demographic factors
The results of the cross tabulations carried out between age shows that Four variables had P<0.05; Safety 0.000, cleanliness 0.000, easy to book 0.0365 and fair prices 0.0445. Two variables had P>0.05; value for money 0.0835 and convenience 0.1185. Cross tabulation between quality of accommodation and gender. Five variables had P<0.05; safety 0.024, easy to book 0.0305, convenience 0.0145 and fair prices 0.0185. two variables yielded P>0.05; cleanliness 0.1275 and value for money 0.323. Cross tabulation between quality of accommodation and level of education. The scores that emanated denoted; safety 0.0095, easy to book 0.002, and fair prices 0.000 all at P0.05.
Cross tabulations between monthly income and types Accommodations
The scores of the cross tabulation between monthly income before tax and university accommodation indicate that those preferred university accommodation were as follows: 75.3% (64) who earned under KES 60,000; 50% (35) earned between 60,000 and 120,000; 65.4% (17) earned 120,001- 240,000; 57.1% (4) earned 240,001 - 360,000; 42.9% (9) earned 360,001 - 600,000.
The international students who did not choose private hostels included: 92.9% (79) who earned under 60,000; 88.6% (62) earned 60,000 -120,000; 100% (26) earned 120,001- 240,000; 83.3% (5) earned 240,001 - 360,000 and 75% (15) earned 360,001 - 600000. Those who delight in private hostels comprised: 7.1% (6) with earnings under 60000; 11.4% (8) earned 60,000 -120,000; 16.7% (1) earned 240,001 - 360,000 whereas 25% (5) earned 360,001 - 600,000. The findings reveal that majority of the students did not favor private hostels. The students who do not succeed in getting accommodation on-campus rely on off-campus accommodation offered at rates varying from KES 3,000 to Kes 15000 a month (Capital Campus, 2017).
Motels were not favored by all earning categories: Majority of the foreign scholars did not fancy motels. Students operate on a tight budget and consider the accommodation prices (Besciu, 2013).
Holiday apartments were not popular to the respondents: 92.9% (79) earned under 60,000; 82.9% (58) earned 60,000 -120,000; 69.2% (18) earned 120,001- 240,000; 83.3% (5) earned 240,001 - 360,000 and 75% (15) earned 360,001 - 600000. Those who preferred the holiday apartments were few: 7.1% (6) earning under 60000; 17.1% (12) earned 60,000 -120,000; 30.8% (8) earned 120,001- 240,000; 16.7% (1) earned 240,001 - 360,000 whereas 25% (5) earned 360,001 - 600,000. The result findings therefore reveal that holiday apartments were not favored by the foreign scholars. Cheaper accommodations such as those provided by the wild life clubs of Kenya (WCK) (WCK, 2017; App 3).
Backpacker accommodation was not a favorite as far as disposable income was concerned: 94.3% (66) earned below 60,000; 82.8% (48) earned 60,000 -120,000; 95.5% (21) earned 120,001- 240,000; 85.7 % (6) earned 240,001 - 360,000 and 96% (24) earned 360,001 - 600000. Those who preferred backpacker accommodation were a handful: 5.7% (4) earned under 60000; 17.2% (10) earned 60,000 -120,000; 4.5% (1) earned 120,001- 240,000; only 14.3% (1) of those who earned 240,001 - 360,000 and only 4% (1) earned 360,001 - 600,000.
Besciu, I. G. (2013). Behavior of the consumer of tourist entertainment services. Cactus Tourism Journal, 4, 9-19.
Capital Campus (2017). A Guide to Student Accommodation in Kenya Capital Digital Media. Capital Group Limited.
Cronbach, L. J. (1951). Coefficient alpha and the internal structure of tests. Psychometrika 16, 3.
CUE, C. f. (2014). Universities authorized to operate in Kenya Quality the agenda. Nairobi CUE.
Finlay, A. A. (2014). Statistical options for the social sciences.
Grigolon, A. B. (2012). The influence of low fare airlines on vacation choices of students. Results of a stated portfolio choice experiment. Tourism Management, 33, 1174-1184.
Lyons, M. T. (2012). The effect of short term environmental citizenship. Environmental Education Research, 18, 403-416.
Polsjski, C. (2011). On Your Own Sexual and Reproductive Health of Female International Students in Australia. Melbourne Australia Multicultural Centre for Women’s Health.
Singh, K. (2015). Sampling and sampler size estimation. Social science Study com.
Vision (2014). Second Medium Term Plan.
Yammane, T. (1967). Statistics An intrductory Analysisn New York Harper and Row.
-
 Table 1
 -
Table 2
-
Table 3
-
Table 4
-
Table 5
-
Table 6


