
3605
Views & Citations2605
Likes & Shares
INTRODUCTION
Candesartan (CAN) and losartan (LOS) are chemically (1RS)-1-[[(Cyclohexyloxy) carbonyl] oxy] ethyl 2-ethoxy-1- [[2-(1 H-tetrazol-yl) biphenyl-4-yl] methyl]-1H-benzimidazole-7-carboxylate and 2-Butyl-4-chloro-1-{[2′-(1H-tetrazol-5-yl) (1,1′-biphenyl)-4-yl] methyl}-1H-imidazole-5-methanol, respectively [1]. They are angiotensin II receptor antagonists so used in treatment of hypertension [2,3]. Several methods have been reported for determination of both drugs including spectrophotometry [4-6], spectrofluorimetry [7,8], HPLC [9,10], and HPTLC [11].
On the other hand, atenolol (ATL) chemically is 2-[4-[(2RS)-2-hydroxy-3-[(1-methylethyl) amino] propoxy] phenyl acetamide [12]. It is an adrenergic beta blocker and used as antihypertensive agent [13]. several methods have been developed for determination of ATL, including UV spectrophotometric methods [14,15], HPLC [16-17], FT-IR spectroscopy [18], and GC-MS [19] (Figure 1).
To the best of our knowledge, there is no method that has been reported for the simultaneous chromatographic separation of the three drugs despite their synergistic action. As such, the present work introduces a simple, rapid, reproducible and sensitive chromatographic method that has been established and validated for the determination of the antihypertensive mixture in their pure forms and in their tablet dosage form according to ICH guidelines [20].
MATERIALS AND METHOD
Instrumentation
HPLC apparatus equipped with a Surveyor quaternary pump with Intel vacuum degasser (Thermo Scientific Co. USA), Surveyor autosampler plus (Thermo Scientific Co., USA), Surveyor photodiode array detector (PDA) (Thermo Scientific Co. USA), Hypersil® gold C18 (10 um, 100 x 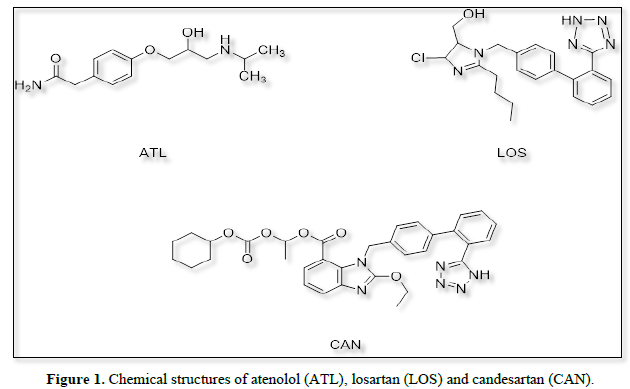
4.60 mm) column (Thermo Scientific Co. USA), Autosampler vials 1.8 mL screw cap, (Thermo Scientific, USA), and computer loaded with software Chromo quest 5 (Surveyor Thermo Scientific Co. USA), for data collection and analysis.
Chemicals and Reagents
All solvents and reagents were of an HPLC analytical grade including acetonitrile (Merck), potassium dihydrogen phosphate (Sigma-Aldrich) and orthophosphoric acid (Fisher Scientific). ATL was provided by Sigma Company, Egypt, LOS was provided by Eipico Company, Egypt, while CAN was provided by Global Nabi Pharmaceuticals, Egypt. Ateno® tablets (Eipico, Egypt), Cozaar® tablets (Merk sharp Dohme), and Candalkan® tablets (Future pharmaceutical industries, 6 October City, Egypt) were labeled to contain 50 mg ATL, 50 mg LOS, and 10 mg CAN.
General procedures
Preparation of standard solutions
Stock solutions of ATL, LOS and CAN (500 µg/ mL) were prepared by dissolving 50 mg of each drug in 100 mL methanol in volumetric flasks.
Construction of calibration curves
Working solutions were prepared immediately before use by further dilutions of the stock solutions with methanol, to cover the concentration range from (5-50 µg/mL) for each drug. Detection was performed at wavelength 225 nm. The calibration graph was constructed by plotting the peak areas obtained versus the corresponding injected concentrations.
Preparation of synthetic laboratory-prepared mixtures in the presence of CAN acid and H2O2 degradation products
The synthetic laboratory mixture was prepared by transferring aliquots of each standard solution of ATL, LOS and CAN (50 µg/mL) to a series of 10 mL volumetric flasks, beside to adding 20 µg/mL of acid or H2O2 degradation products of CAN and completing to 10 mL with the mobile phase.
The stress degradation study was carried out according to the ICH requirements [20]. In case of acid degradation, CAN sample was prepared by weighing 20 mg of CAN and transferring in 50 mL conical flask followed by treating with 0.1 M HCl and keeping at 800 C for about 30 min to accelerate acid hydrolysis [21]. On the other hand, in case of oxidation with H2O2, CAN sample was prepared by weighing 20 mg of CAN and transferring in 50 mL conical flask followed by treating with hydrogen peroxide (5% v/v) and keeping at 80 0C for about 120 min to accelerate oxidation of CAN [21].
Preparation and analysis of pharmaceutical preparations
20 tablets of Ateno®, Cozaar® and Candalkan® were weighed and powdered. An accurately amount of the powder equivalent to (50 mg) of each drug was dissolved in 15 mL of the mobile phase, filtered, washed and collected into 25 mL measuring flask and completed to volume with the mobile phase. Working solutions were prepared as in the above procedure and completed as previously mentioned under the general procedure.
RESULTS AND DISCUSSION
Optimization of Chromatographic Conditions
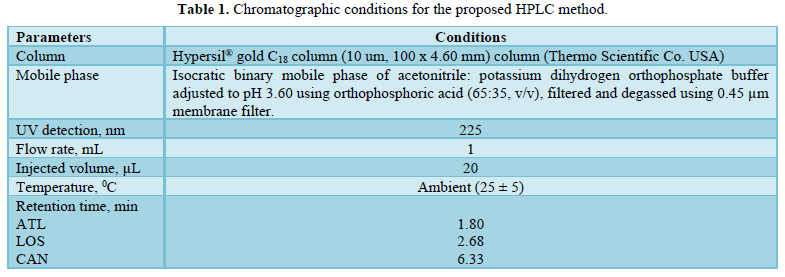
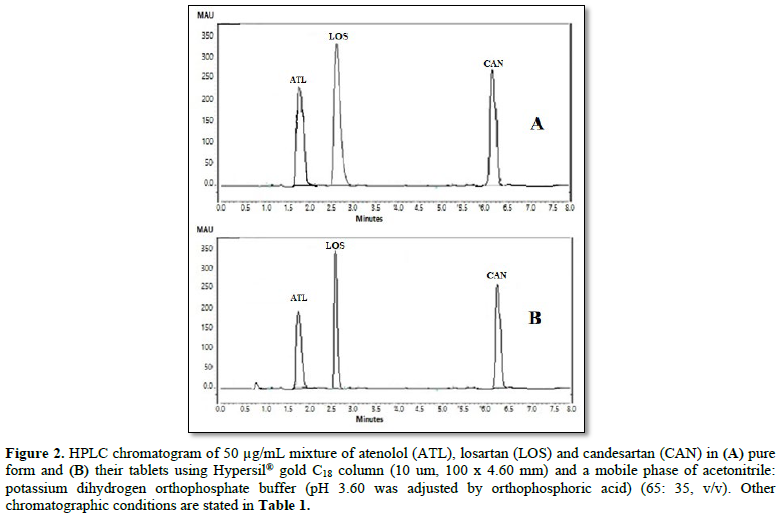
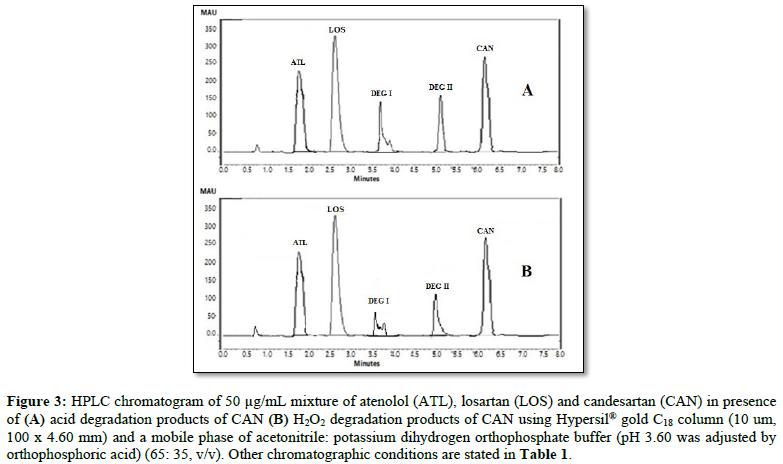
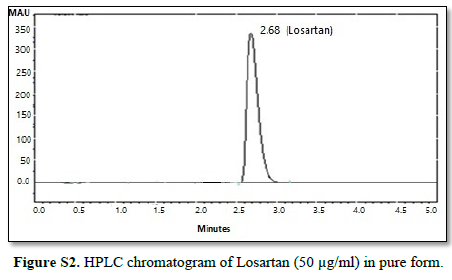
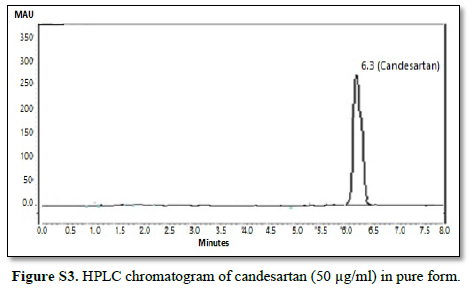
All chromatographic conditions are illustrated in Table 1. The chromatographic detection was performed at 225 nm using Surveyor photodiode array detector (PDA) (Thermo Scientific Co. USA). The method was performed on a Hypersil® gold C18 (10 um, 100 x 4.60 mm) column (Thermo Scientific Co. USA). It was observed that when a combination of all the three drugs was injected, CAN gave peak at far retention time. Chromatographic conditions were optimized by changing the mobile phase composition, buffers used in the mobile phase, pH and flow rate. The optimized mobile phase was determined as a mixture of acetonitrile: potassium dihydrogen phosphate adjusted to pH 3.60 using orthophosphoric acid at a flow rate of 1 mL/min. Under these conditions, ATL, LOS and CAN were simultaneously eluted at 1.80, 2.68 and 6.33 min, respectively, with a total run time of 8 min as seen in Figure 2A. Also, a typical chromatogram for simultaneous estimation of the three drugs obtained by using the aforementioned mobile phase is illustrated in Figure 2B for drug mixture in tablets formulation. Furthermore, the method was successful in determination of the three drugs in presence of degradation products of CAN either under acid hydrolysis or oxidation stress as seen in Figures 3A & 3B.
METHOD VALIDATION
The method was validated according to international conference on harmonization (ICH) guidelines [20].
Linearity
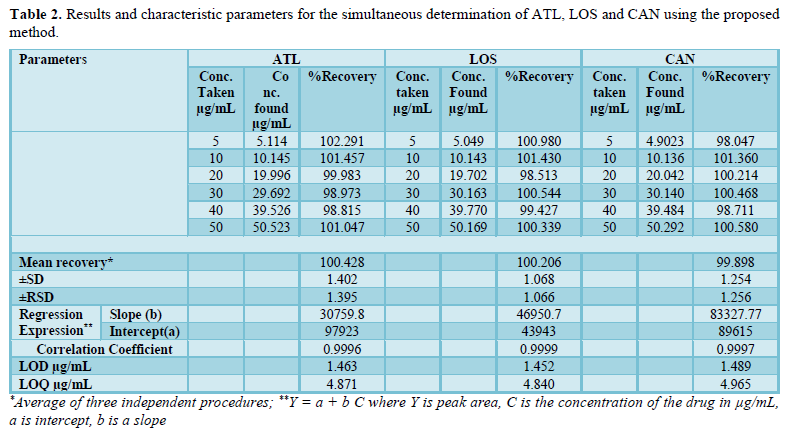
Six different concentrations of a mixture of all three drugs were prepared for linearity studies. The response was measured as peak area. The calibration curves obtained by plotting peak area against concentration showed linearity in the concentration range of 5 -50 µg/mL in case of the three drugs. Linear regression equations of ATL, LOS and CAN were found to be y = 30760x + 97923, y = 46951x + 43943 and y = 83328x -89615, respectively and the regression coefficient values (r) were found to be 0.9996, 0.9999 and 0.9997, respectively indicating a high degree of linearity for all drugs. The calibration graph was described by the following equation:
Y= a + bX
Where Y=peak area, a=intercept, b=slope, X=concentration in µg/mL. All analytical merits for the calibration data are summarized in Table 2.
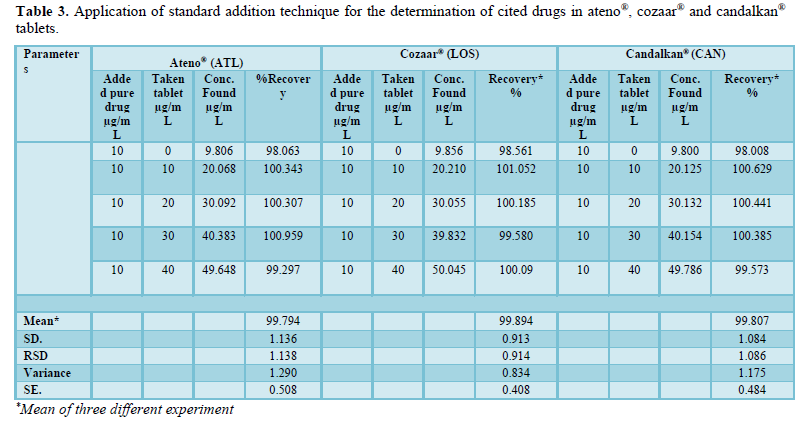
Accuracy
The accuracy of the method was determined by investigating the recovery of drugs at 5 concentration levels covering the specified range (three replicates of each concentration). Standard addition method was used for determination of ATL, LOS and CAN in ateno®, cozaar® and candalkan® tablets and the results showed excellent recoveries (99.79 - 99.89%) as seen in Table 3.
Precision
Intra - day precision was evaluated by calculating standard deviation (SD) of five replicate determinations using the same solution containing pure drugs. Results in Table 4 show that SD values (0.246 - 1.826) revealed the high precision of the method. For inter - day reproducibility on a day - to - day basis, a series was run, in which the standard drug solutions were analyzed each for five days where SD values were also in the acceptable range (0.375 - 1.750) as seen in Table 4.
Specificity
The specificity studies revealed the absence of any excipient or impurity interference, since none of the peaks appeared at the same retention time of ATL, LOS and CAN as shown in Figures 2B and 3. For example, acid degradation products of CAN at 3.70 and 5.10 min, in addition to oxidation degradation products of CAN at 3.58 and 5.00 min were clearly resolved from peaks of the three drugs indicating the high specificity of the method.
LOD and LOQ
For determining the limit of detection (LOD) and limit of quantitation (LOQ), the method based on signal - to - noise ratio (3:1 for LOD & 10:1 for LOQ) was adopted. The limit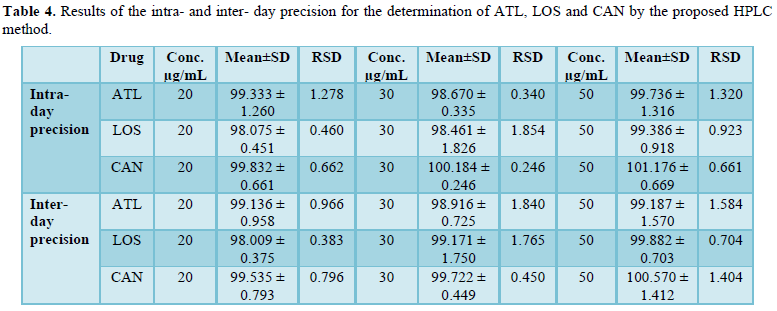
of detection for ATL, LOS and CAN were reported to be 4.871, 4.840 and 4.965 µg/mL while the limit of quantitation was 1.463, 1.452 and 1.489 µg/mL, respectively (Table 2).
Robustness
The robustness of the method was evaluated by making small changes in one parameter keeping the other chromatographic conditions constant such as the flow rate (0.90, 1, and 1.10), mobile phase ratio and pH of mobile phase within a range of ± 0.10 unit of the optimized pH where the effect of the changes was studied on the percent recovery of drugs. The changes had negligible influence on the results as revealed by small SD (≤ 1.065) as shown in Table 5.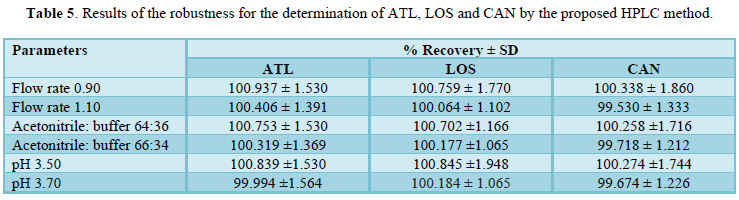
Analysis of pharmaceutical formulations
The validated HPLC method was applied for the simultaneous determination of ATL, LOS and CAN in individual pharmaceutical mixtures. Results obtained were compared to those obtained by applying reported reference methods [22-24] where Student’s t-test and F-test were performed for comparison. It was found that the calculated t and F values were less than tabulated ones for the four drugs (Table 6) which in turn indicate that there is no significant difference between proposed method and reference ones relative to precision and accuracy.
CONCLUSION
HPLC method for rapid simultaneous estimation of atenolol, losartan and candesartan in presence of candesartan degradation products within 8 min was developed and validated. The amounts obtained by the proposed method are between the acceptable range of 99.898 and 100.428%, The results obtained indicate that the proposed method is rapid, accurate, selective, and reproducible. Linearity was observed over a concentration range of 5 to 50 µg/mL for all the three drugs. The method has been successfully applied for the analysis of marketed tablets. It can be used for the routine analysis of formulations containing any one of the above drugs or their combinations without any alteration in the assay.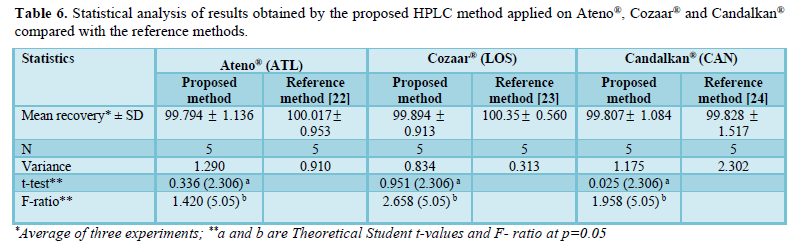
ACKNOWLEDGMENT
Authors are thankful to the whole staff member at Medicinal Chemistry Department, Faculty of pharmacy, Zagazig University for providing facility to carry out the research work.
-
The British Pharmacopoeia (2013) HM Stationary Office, London. Vol: 2 pp: 1355-1357.
-
Shantanu B, Lohit B, Devi L (2013) An explicit review on quantitative estimation of candesartan cilexetil employing various analytical techniques, Pharma Anal Acta 4(6): 1-7.
-
Patil RP, Sachin UR, Dhabale P, Burade K (2009) Simultaneous UV spectrophotometric method for estimation of losartan potassium and amlodipine besylate in tablet dosage form. Asian J Res Chem 2(2): 183-187.
-
Padmalatha H, Vidyasagar G (2011) Quantitative estimation of candesartan by UV spectrophotometry. Int J Pharm Technol 3(2): 2653-2658.
-
Sevgi T, Serap S (2004) Comparison of UV- and second derivative spectrophotometric and high-performance liquid chromatographic methods for the determination of losartan in tablets. Turk J Pharm Sci 1(3): 165-175.
-
Ibrahim AD (2005) Analytical study for the charge-transfer complexes of losartan potassium. Anal Chim Acta 549: 212-220.
-
Amir A, Hanan F (2010) Determination of candesartan cilexetil in tablets by spectrofluorimetry. Int J Pharm Sci Rev Res 4(1): 60-63.
-
Taher M, Asadollahzadeh H, Fazelirad H (2015) A simple spectrofluorimetric method for the determination of losartan in some tablet dosage forms. J Appl Spectrosc 82(5): 842-844.
-
Ganesh A, Kandikonda S, Saikumar B, Rasapally R, Santhosh KK RP- HPLC method development and validation of candesartan cilexetil in bulk and their pharmaceutical dosage forms. Int J Pharm Sci Res 1(12): 191-196.
-
Kirtawade R, Salve P, Kulkarni A, Dhabale P (2010) RP-HPLC method for simultaneous estimation of losartan potassium and atenolol in tablet formulation. Int J Pharm Sci 1(2): 50-56.
-
Sathe SR, Bari SB (2007) Simultaneous analysis of losartan potassium, atenolol, and hydrochlorothiazide in bulk and in tablets by high-performance thin-layer chromatography with UV absorption densitometry. Acta Chromatogr 19: 270-278.
-
Nagaraja SK, Chakravarthi IE (2013) A UV-visible spectrophotometric determination of atenolol in pharmaceutical formulations. Int J Sci Res 2(3).
-
Lalitha KV, Kiranjyoth IR, Padma B (2013) UV spectrophotometric method development and validation for the determination of atenolol and losartan potassium by Q-analysis. Int Bull Drug Res 3(4): 54-62.
-
Pawar PV, Gaikwad PD, Bankar VH, Pawar SB (2010) Development and validation of UV-spectrophotometric method for simultaneous estimation of atenolol and indapamide in bulk and tablet dosage form. Int J Pharm Technol 2(4): 876-885.
-
Shelke OS, Sable KS, Neharkar VS, Mathdevru BV (2012) Development and validation of a UV spectrophotometric method for the simultaneous determination of nifedipine and atenolol in combined dosage form. Int Res J Pharm 3(4): 360-364.
-
Bhaskara BL, Anil KS, Anil K (2011) A facile and rapid HPLC method for determination of atenololin pharmaceutical formulations. Asian J Appl Sci 4(3): 306-313.
-
Bhusari VK, Dhaneshwar S (2012) Validated HPLC method for simultaneous quantitation of amlodipine besylate, atenolol and aspirin in bulk drug and formulation. J Pharm Biomed Sci 17(17).
-
Gireesh K, Chanti NM, Padma Y, Venkata RM, Madhu M, et al. (2014) Novel FT-IR spectroscopic method for the quantitation of atenolol in bulk and tablet formulation. J Glob Trends Pharm Sci 5(3): 1750-1755.
-
Bilal Y, Sakir A (2011) Determination of atenolol in human urine by gas chromatography - mass spectrometry method. J Chrom Sci 49: 365-369.
-
International Conference on Harmonization of Technical Requirements for Registration of Pharmaceuticals for Human Use, ICH Harmonized Tripartite Guideline, Validation of Analytical Procedures: Text and Methodology Q2(R 1), Complementary Guideline on Methodology dated 06 November 1996, incorporated in November 2005, London.
-
Katiyar M, Kushwaha D, Shukla R (2012) Specific and stability indicating assay method of candesartan cilexetil in presence of process and degradation impurities. Int J Pharm Innov 2(5): 1-10.
-
Pawar P, Gaikwad P, Bankar V, Pawar S (2011) Development and validation of RP-HPLC method for simultaneous estimation of atenolol and indapamide in pharmaceutical dosage form. Int J Res Ayur Pharm 2(3): 918-923.
-
Hany M, Abdullah A, Lobna M, Magda M (2013) Quantitative determination of three angiotensin-II-receptor antagonists in presence of hydrochlorothiazide by RP-HPLC in their tablet preparations. Iran J Pharm Res 12(4): 635-643.
-
Mary S, Subba R, Vineetha P, Spandana K, Tasleem B (2012) Simultaneous estimation and validation of candesartan and hydrochlorothiazide in tablet dosage form by RP-HPLC method. Int J Adv Pharm Sci 3(5): 325-332.
SUPPLEMENTARY DATA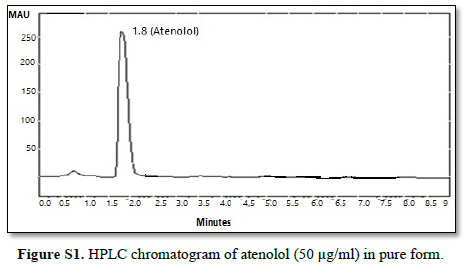
-
 Table 1
 -
Table 2
-
Table 3
-
Table 4
-
Table 5
-
Table 6


