
4090
Views & Citations3090
Likes & Shares
From historical studies, however, we can evaluate change in position and size of the various parts of the mandible [3]. A mathematical description can also be applied to such growth and changes and this will be outlined here.
METHOD
A series of 100 sets of longitudinal echometric radiographs [4], drawn from the archives of the Electric Jockstrap Research Institute of the University of Neasden, London, UK were used in the study. These were digitized using the regular cephalometric points as used in the Eastman and Ricketts analysis. The data was then entered into the VACC-u M-series Mark VI mainframe computer system where the points were averaged and means and standard deviations obtained. The standard deviations were extended to include all possible outlying data.
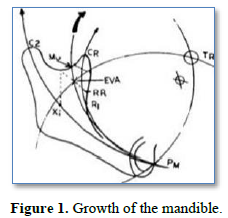
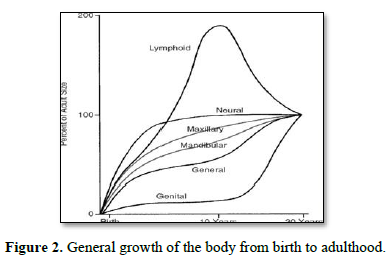
The data thus obtained was subjected to artificial intelligence using the CRA-Programme which has been developed at this university. The algorithms generated were thus able to take account of variation within the growth patterns and by entering one initial cephalogram we were able to predict the outcome on the final cephalogram within four standard deviations of the mean (Figures 1 & 2).
MATHEMATICAL METHOD

RESULTS
The results showed that the mandible grows in several ways depending on what superimposition is used. The mandibular border method of superimposition will show that the mandible grows upwards, while the condylar method of superimposition will show that growth is downwards and forwards. Growth at the symphysis is forwards and backwards.
Superimposition on the first molar shows that it is superimposed on the first molars. There is a wide variety of patterns produced and it is essential that accurate superimposition takes place.
DISCUSSION
The results showed that the mandible grows in several ways depending on what superimposition is used. The mandibular border method of superimposition will show that the mandible grows upwards, while the condylar method of superimposition will show that growth is downwards and forwards. Growth at the symphysis is forwards and backwards. Superimposition on the first molar shows that it is superimposed on the first molars. There is a wide variety of patterns produced and it is essential that accurate superimposition takes place.
CONCLUSIONS
By applying this mathematical formula, we can predict the growth of the mandible. The normal variation within the sample is accounted for by including all standard deviations.
- Berk A (1988) Rotating the mandible, a normal feature of mouth opening. J Neasden Orthodont Soc 2: 6-9.
- Stunt C (2007) Why I am a complete pillock and don’t have a clue about Am J Dead Sheep 17: 20-47.
- Tabernacle C (2020) The mandible is attached to the skull and goes up and Eur J CRA-Program Stud 12: 50-58.
- Sole R (2002) Lateral cephalograms - A new development in diagnosis and treatment Transactions of the Serbo-Croat Society of Orthopaedic Odonto-Stomatology 16: 67-81.


QUICK LINKS
- SUBMIT MANUSCRIPT
- RECOMMEND THE JOURNAL
-
SUBSCRIBE FOR ALERTS
RELATED JOURNALS
- Chemotherapy Research Journal (ISSN:2642-0236)
- Journal of Carcinogenesis and Mutagenesis Research (ISSN: 2643-0541)
- Journal of Allergy Research (ISSN:2642-326X)
- Journal of Cancer Science and Treatment (ISSN:2641-7472)
- International Journal of Radiography Imaging & Radiation Therapy (ISSN:2642-0392)
- Journal of Neurosurgery Imaging and Techniques (ISSN:2473-1943)
- International Journal of Medical and Clinical Imaging (ISSN:2573-1084)


