
3602
Views & Citations2602
Likes & Shares
Abbreviations: ANOVA: Analysis of Variance; DNA: Deoxyribonucleic Acid; DPX: Di-n-butyl Phthalate in Xylene, H and E, H & E: Hematoxylin and Eosin Stain; ICMR: Indian Council of Medical Research; MGG: May-Grunwald-Giemsa; MN%: Micronucleus Percentage; MN: Micronucleus; MNC: Micronucleated Cell; Mini: Micronuclei; NS: Not Significant; OSCC: Oral Squamous Cell Carcinoma; PAP: Papanicolaou; S: Significant; SCC: Squamous Cell Carcinoma; WHO: World Health Organization
Oral squamous cell carcinoma (OSCC) is a multistage process which on exposure of carcinogens (smoking and smokeless associated) cause complex karyotypes that involve many chromosomal deletions, translocations, and structural abnormalities [4,5]. Detection of these genetic changes resulting from errors in DNA metabolism, in buccal mucosal cells can be done by using biomarkers that help in identifying individuals vulnerable to malignant transformation [6]. Micronucleus is one such standard biomarker in the field of oral cancer [7]. Biologically, micronuclei (Mini) are the chromosome fragments or whole chromosomes that lag behind at anaphase during nuclear division [8].
After telophase, the undamaged chromosomes, as well as the centric fragments, give rise to regular daughter nuclei. The lagging elements are included in the daughter cells, but a considerable proportion is transformed into one or several secondar nuclei, which are, as a rule, much smaller than the principal nucleus and are therefore called micronuclei. Bigger micronuclei result from exclusion of whole chromosome following damage to the spindle apparatus of the cell (A eugenic effect), whereas smaller micronuclei result from structural aberrations; causing chromosomal fragments (Clastogenic effect) [9].
Besides these two important mechanisms, MN may be formed due to broken anaphase bridges. This may be because of dicentric chromatids, intermingled ring chromosomes, union of sister chromatids or from extrachromosomal elements called double minutes [10].
The assessment of micronuclei in exfoliated cells is a promising tool for the study of epithelial carcinogens [11]. Screening of individuals who are at high risk of malignant transformation is more pivotal in preventing and reducing the number of deaths. It is evident that the individual cancer risk can be predicted on the basis of increase in number of micronuclei in the oral epithelial cells [5]. Hence this study was done to compare the level of micronucleus & micronucleated cells in normal subjects and OSCC subjects. Also, number of micronucleus and micronucleated cells were compared in different grades of oral squamous cell carcinoma.
METHOD AND MATERIAL
The study was conducted in the Department of Oral and Maxillofacial Pathology and Department of Oral Medicine and Radiology of Karnavati School of Dentistry, Uvarsad, Gandhinagar, the data collection consisted of randomly selected sixty cases and divided into following groups.
Group A: Thirty healthy controls with no oral lesions, no previous tobacco-related habits, and no previous medical history with age and sex matching with diseased cases Group B: Thirty histopathologically proven cases of oral squamous cell carcinoma. Table 1 shows gender wise distribution of cases.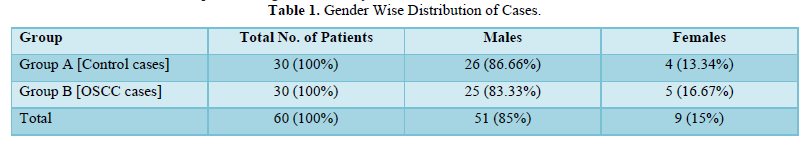
In each group cases were given a standard questionnaire interview and their history was recorded. A written consent was taken from cases of both Groups. Routine hematological investigations were carried out in study cases prior to biopsies.
Collection of Exfoliated cells: The participants of study were asked to rinse their mouth with water and a pre- moistened wooden spatula was used to sample cells from lesional area of Group B (Oral Squamous Cell Carcinoma) cases and from the buccal mucosa of Group A (Control) cases. The cells were immediately smeared on pre-cleaned microscopic slides.
The smears were fixed with fixative solution for minimum fifteen minutes (80% methyl alcohol + glacialacetic acid fixative mixed in ratio 3:1). The smears were stained with Feulgen stain.
Biopsy procedure: Incisional/punch biopsy in cases with oral lesions was taken for histopathologic examination. The specimens were placed in 10% neutral buffered formalin for fixation for minimum 24 hours. The biopsies were processed in automated tissue processor, embedded in paraffin wax blocks. 4-5µm thick sections were prepared, stained with routine H and E stain, and mounted using DPX mount ant. Then they were analyzed for confirmed histopathological diagnosis using light microscope. Only histopathologically proven cases of OSCC were considered in the study.
H and E-stained sections of Group B cases (Oral Squamous Cell Carcinoma cases) were evaluated and graded using Broder’s classification.
Broder’s classification (1920): In each group cases were given a standard questionnaire interview and their history was recorded. A written consent was taken from cases of both Groups. Routine hematological investigations were carried out in study cases prior to biopsies.
Collection of Exfoliated cells: The participants of study were asked to rinse their mouth with water and a pre- moistened wooden spatula was used to sample cells from lesional area of Group B (Oral Squamous Cell Carcinoma) cases and from the buccal mucosa of Group A (Control) cases. The cells were immediately smeared on pre-cleaned microscopic slides.
The smears were fixed with fixative solution for minimum fifteen minutes (80% methyl alcohol + glacialacetic acid fixative mixed in ratio 3:1). The smears were stained with Feulgen stain.
Biopsy procedure: Incisional/punch biopsy in cases with oral lesions was taken for histopathologic examination. The specimens were placed in 10% neutral buffered formalin for fixation for minimum 24 h.
The biopsies were processed in automated tissue processor, embedded in paraffin wax blocks. 4-5µm thick sections were prepared, stained with routine H and E stain, and mounted using DPX mountant. Then they were analyzed for confirmed histopathological diagnosis using light microscope.
Only histopathologically proven cases of OSCC were considered in the study.
H and E-stained sections of Group B cases (Oral Squamous Cell Carcinoma cases) were evaluated and graded using Broder’s classification.
Broder’s classification (1920) Cases of Oral squamous cell carcinoma was graded on the basis of degree of differentiation and keratinization of tumor cells into:
- Grade I: Well differentiated tumors - 75-100% of cells are differentiated
- Grade II: Moderately differentiated tumors - 50-75% of cells are differentiated
- Grade III: Poorly differentiated tumors - 25-50% of cells are
- Grade IV: Anaplastic tumor - 0-25% of cells are differentiated [12].
Evaluation of micronucleus in cytology:
All the slides of cytology smears were stained with Feulgen stain and observed under low magnification (10X) for screening and high magnification (40X) for counting of MN.
The zigzag method was used for screening slides and 500 cells with intact nuclei and cell boundaries were counted per patient.
Scoring criteria:
The scoring of micronucleus was done according to criteria given by Tolbert [13]
- Rounded smooth perimeter.
- Less than one third diameter of the associated nucleus, but large enough to discern shape and
- Staining intensity similar to that of nucleus
- Texture similar to that of nucleus
- Same focal plane as nucleus
- Absence of overlap, with or bridge to, the nucleus
The exclusion criteria considered when scoring of micronuclei was done were broken eggs, nuclear budding, binucleated cell, karyomeric, karyolitic [7].
Observations were expressed in form of No. of micronucleus (MN) in each patient, No. of micronucleated cells (MNC) per patient and Micronucleus percentage (MN%).
Micronucleus percentage was counted using this formula: 100 X total number of micronuclei found in a Group. No. of cells counted per patient (500) X total number of patients in a Group Statistical Analysis: - The data obtained was statistically analyzed using ANOVA test and correlation was calculated using Pearson’s correlation using SPSS 18.0 software.
RESULTS AND OBSERVATIONS
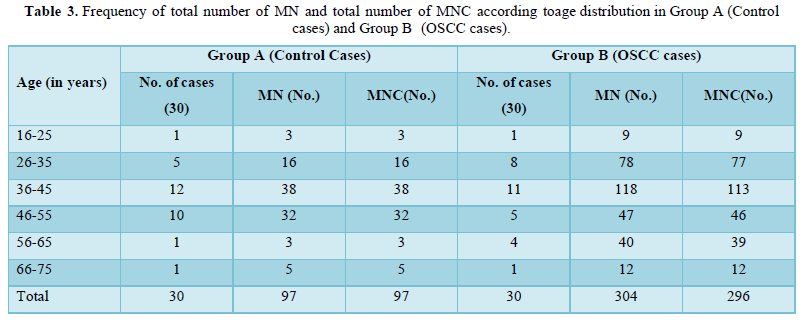
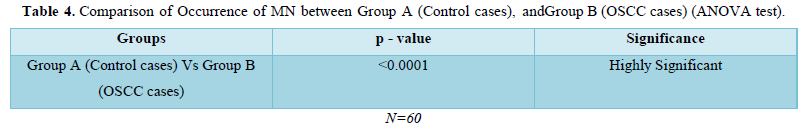
The study comprised of 60 subjects 30 controls and 30 cases of OSCC. As shown in Table 1 were 26 males and 4 females in control group and 25 males and 5 females in OSCC case group. Table 2 shows mean of micronucleus, micronucleated cell & MN % in group A and group B, 0.66% and 2.46% respectively. On comparison using ANOVA test highly significant difference of 0.0001 is obtained between group A and group B (Table 3). Table 4 shows age distribution of cases in the study with interval of 10 years and no of cases in each group. Micronucleus and MNC found in each corresponding age group is shown. In present study highest no. of cases and highest no of MN & MNC were found in 36-45 age group.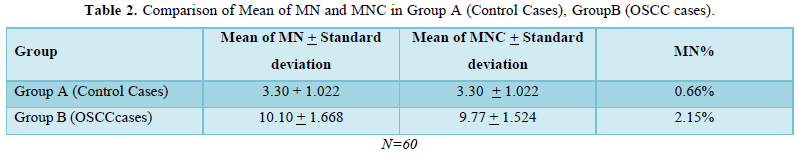
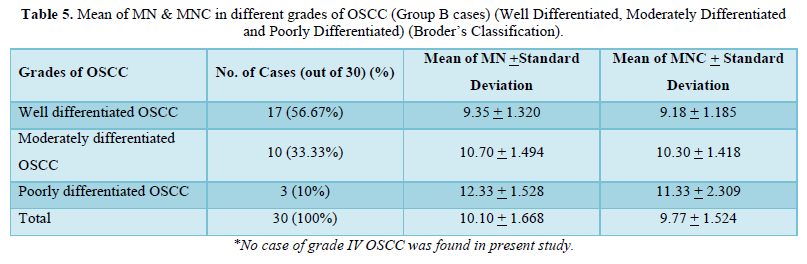
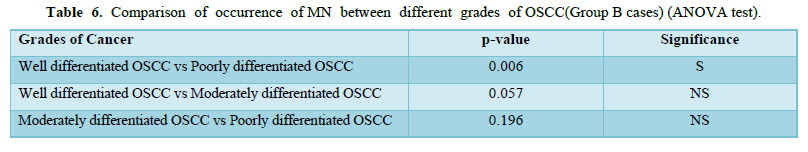
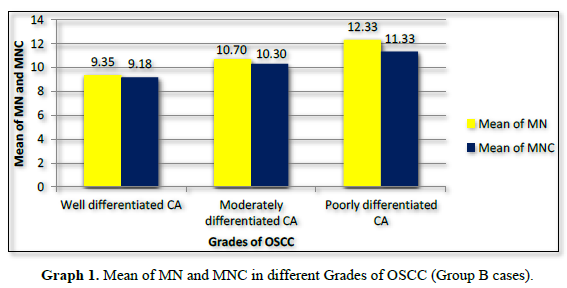
Amongst 30 cases of OSCC 17 were of Well differentiated OSCC, 10 were of Moderately differentiated OSCC and 3 were Poorly differentiated OSCC. The mean of MN and MNC increased from well to moderate to poorly differentiated OSCC as shown in Table 4 and Graph 1 but statistically significant difference was only seen between well and poorly differentiated OSCC (Tables 5 & 6).
 S = significant, NS = Not significant
MN% was calculated and it increased from 1.87% to 2.14% from well to moderate to poorly differentiated carcinoma respectively (Graph 2).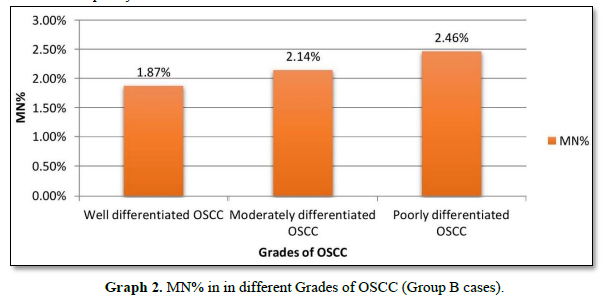
DISCUSSION
William Howell, an American, and Justin Jolly, a Frenchman were first to identify Micronuclei (MN), also known as Howell–Jolly bodies, in red cell precursors. Initially, Howell-Jolly bodies were described as remnants of nuclei of red blood cells circulating in organs with pathology. So later on, the micronucleus technique was proposed as a reliable method for measuring chromosomal damages caused by cytotoxic agents “it vivo” by Fenech and Morley in 1985 [14]. Burkhardt [15] suggested that the MN test applied to exfoliated cells could provide valuable information and improve the evaluation of carcinomas by exfoliative cytology [15].
It has been documented by Gupta [16] that the habit of chewing gutkha had gained considerable popularity among the younger men in India [16]. The rapidly increasing prevalence of this habit can be judged from the reports that the Indian market for pan masala and guthka is worth 43,410.2 crores in 2022 [17].
The carcinogenic agents in tobacco act by inducing changes at both genetic level and locally by providing a conducive local environment for hyperplastic transformation of the buccal cells [18]. Also, micronuclei in exfoliated cells emerge during mitosis of the basal layers of the epithelium and their absolute quantities could reflect the real situation in target cells [6]. In a study, levels in exfoliated buccal mucosa cells of patients with breast, lung, cervix uteri cancer, and patients with Hodgkin's disease were studied and levels of MN were found to be elevated in buccal mucosal cells. This reflected level of instability in somatic cell due to cancerous lesions even when there is cancer in distant body organs [19]. The frequency of micronucleated cells do reflect the capacity of target tissues to activate procarcinogens into reactive species or to inactivate or trap ultimate carcinogens [20].
Hence, this study was performed with primary aim of evaluating frequency of micronuclei in exfoliated cells of buccal mucosa from healthy control subjects and squamous cell carcinoma patients. Also, micronucleus & micronucleated cell frequencies in different grades of oral squamous cell carcinoma were compared.
The oral squamous cell carcinoma cases in our study comprised of 83.33% males and 16.67% females. These figures were found to be similar to the studies conducted by Dindigre [21] who had 85% males in malignant group and Casartelli [22] who had 85.71 % of males in their respective studies [22]. This gender distribution show that habits being prevalent more in males and that occurrence of cancerous lesions are seen more in them as compared to controls.
In present study maximum number of cancer cases was recorded in age range of 26-45 i.e., 2nd to 4th decade (as shown in Table 3). But contrary to our study the age range of cancer subjects in other studies [5,21-24] were seen more after 5th decade. The reason for prevalence of cancer in early decade of life in our study could be beginning of habits at early age during middle school and high school period and hence higher incidence of cancerous lesions in early half of life span [25].
In their study Grover [26] concluded that because of the possibility of mis-interpretation of nuclear anomalies (e.g., karyorrhexis, karyolitic, condensed chromatin binucleates and keratin granules) as MNi with nonspecific stains, a higher count was observed with PAP and H and E stain [26]. Contrary to this Kamboj [20] in their study concluded that fluorescent stain was more sensitive than Feulgen stain. Jyoti [27] also concluded that chances of errors during scoring MN are less when cells are stained using fluorescent stain such as acridine orange. Fluorescent staining technique involves use of acridine orange stain which is costly and also involve use of fluorescent microscope which is more technique sensitive and adds up to the cost.
So, in our study we used Feulgen staining technique and binocular microscope for analysis of micronuclei which was simple and economical. Feulgen staining technique is also known for high DNA specificity and a clear transparent appearance of the cytoplasm which enables easy identification of MN [26]. Also, it is most common stain used for scoring of MN.
In present study, MN count per 500 cells in controls was 97 and that in cancerous lesion group was 304. This shows that MN count increases more than 3 times in cancer cases as compared to that in controls.
Dindigire [21] in their study inferred that MN count per 500 cells was 28 (20 subjects) in tobacco users without any lesion and that in malignant conditions was 166 among 20 subjects. This study used PAP and MGG (May Grunwald Giemsa) stain [21]. Also, in their study to determine MN index as early diagnostic criteria of carcinoma Sivasankari PN et al (2008) found total 77 MN in control and total 145 MN in Malignant cases using MGG stain [24].
All these studies, including ours, have shown that there is almost double to triple fold increase in MN and MNC count as severity of disease increases.
Mean of MN and MN% increase from control to OSCC cases in present study. In relation to mean of MN, in study done by Casartelli [22] showed increase from 1.5 in controls to 4.4 in cancerous conditions. Similar were findings of other studies [20,21,24]. In present study mean of MN increased from 3.30 in controls to 10.10 in cancer cases. When viewed in relation to MN % apart from other studies (5,23,28) our study showed increase in MN% from control to OSCC cases. In our study MN% increased from 0.66% in controls to 2.15% in OSCC cases. Our study inferred that micronucleus frequencies and frequency of micronucleated cells increase from controls to cancerous lesions subjects. Also, the occurrence MN frequencies in controls and cancerous conditions showed statistically significant difference in our study (p<0.0001) and these findings are similar to above mentioned studies.
These variations in micronucleus, micronucleated cells and MN% may be attributed to the ingredients in the quid, the number of quids per day and to the different lifestyles and food habits of people where study is conducted [20]. Also, variability may be due to scoring criteria and staining procedures used [7].
The levels of MN% in our study in SCC groups (from well differentiated OSCC to moderate differentiated OSCC to poorly differentiated OSCC) was between 1.87% to 2.46% whereas that in study done by Palve [9] was between 1.1% to 3% and that between Kumar V et al (2000) was between 1.4% - 9.15 %. The reason for this difference was different technique used for assessing exfoliated cells. Palve D et al (2008) used rapid papaniculaou technique whereas Kumar V et al (2000) used fluorescent dyes for staining purpose whereas present study utilized feulgen staining technique. Also, Kumar V et al (2000) in their study obtained cells by mincing biopsy tissue and prepared cell suspensions from it, whereas in our study simple non-expensive method of exfoliative cytology was used. As different techniques are used to obtain samples and different staining techniques used there are variations in number of micronucleated cells and micronucleus counts in various studies [9].
The present study, studies of Palve [9], Saran [28] showed increase in micronucleus from low grade carcinoma to poor grade carcinoma. The reason for this increase in micronucleus count with increase in grades of carcinoma can be attributed to increased DNA damage in relation to tumor grade as there is gradual progression of carcinogenic process [28].
Hence this study shows that with increase in severity of disease the MN frequencies increase and also that with increase in MN% individual cancer risk increases. Present study has used border’s classification for histopathological grading and Feulgen stain for identifying micronuclei. Future studies are suggested to be with larger sample size and performed longitudinally to evaluate the lesions and also addressing sources of variability like strict adoption of optimal scoring criteria using standard histopathological grading system and other DNA specific stains in the assay to confirm the findings. Comparison of MN with other biomarkers and use of MN assay as a biomarker of genotoxicity in predicting the effects of cancer intervention studies may also be considered.
CONCLUSION
- Occurrence of micronucleus and micronucleated cell increases from Controls to OSCC cases and that there is statistically significant difference (p value < 001) for occurrence of MN between controls and OSCC cases (p<0.0001).
- Amongst three stages of cancer MN shows statistically significant difference between well and poorly differentiated
Micronucleus assay is a simple and rapid screening test applied for an early detection of cancer. Thus, this test can be used on exfoliated cells to identify the genotoxic damage in human tissues, which are targets for carcinogens and from which carcinomas develop.
Conflict of interest: None
ACKNOWLEDGMENT
Staff of Department of Oral Pathology and Department of Oral Medicine, Karnavati School of Dentistry, Uvarsad, Gandhinagar. Dr. Girish Mishra (MS ENT, Prof. and Guide, Department of Otolaryngology and Head and Neck surgery, Pramukhswami Medical College, Karamsad. Dr. Daxa Mishra MPT, Ph.D., K.M. Patel Institute of Physiotherapy, Karamsad.
- Sharma LK (2020) ICMR-NCDIR National Cancer Registry Programme estimates 12% increase in cancer cases in the country by 2025: New Indian Council of Medical Research. Accessed on: February 10, 2022. Available online at: https://ncdirindia.org/AllReports/Report_2020/PB/Press_release.pdf
- Borse V, Konwar AN, Buragohain P (2020) Oral cancer diagnosis and perspectives in India. Sens Int 1: 100046.
- Mathur P, Sathishkumar K, Chaturvedi M, Das P, Sudarshan KL, et al. (2020) Cancer Statistics, 2020: Report from National Cancer Registry Programme, India. JCO Glob Oncol 6: 1063-1075.
- Priya B, Spadigam A, Dhupar A, Syed S (2020) Frequency of micronuclei in tobacco habitués and non-Habitués with oral lichen CHRISMED J Health Res 7(3): 151.
- Devi P, Vb T, Mehrotra V, Arora P. (2011) Micronucleus Assay for Evaluation of Genotoxicity in Potentially Malignant and Malignant Disorders. Kailasam S, editor. J Indian Acad Oral Med Radiol 23: 97-100.
- Mahimkar MB, Samant TA, Kannan S, Patil T (2010) Influence of genetic polymorphisms on frequency of micronucleated buccal epithelial cells in leukoplakia patients. Oral Oncol 46(10): 761-766.
- Jadhav K, Gupta N, Ahmed Mujib B (2011) Micronuclei: An essential biomarker in oral exfoliated cells for grading of oral squamous cell J Cytol 28 (1): 7.
- Samanta S, Dey P (2012) Micronucleus and its applications. Baloch Z, editor. Diagn Cytopathol 40(1): 84-90.
- Palve D, Tupkari J (2008) Clinico-pathological correlation of micronuclei in oral squamous cell carcinoma by exfoliative J Oral Maxillofac Pathol 12(1): 2.
- Shimizu N (2011) Molecular mechanisms of the origin of micronuclei from extrachromosomal Mutagenesis 26(1): 119-123.
- Jois HS, Kale AD. (2010) Micronucleus as Potential Biomarker of Oral Carcinogenesis. Indian J Dent Adv 2(2): 197-202.
- Anneroth G, Hansen LS (1984) A methodologic study of histologic classification and grading of malignancy in oral squamous cell Eur J Oral Sci 92(5): 448-468.
- Tolbert PE, Shy CM, Allen JW (1992) Micronuclei and other nuclear anomalies in buccal smears: methods Mutat Res Mutagen Relat Subj 271(1): 69-77.
- Luzhna L, Kathiria P, Kovalchuk O (2013) Micronuclei in genotoxicity assessment: from genetics to epigenetics and beyond. Front Genet [Internet]. 4. Available online at: http://journal.frontiersin.org/article/10.3389/fgene.2013.00131/abstract
- Burkhardt A (1985) Advanced methods in the evaluation of premalignant lesions and carcinomas of the oral J Oral Pathol Med 10: 751-778.
- Gupta MK, Mhaske S, Ragavendra R (2008) Oral submucous fibrosis - Current Concepts in People J Sci Res 1: 39-44.
- India Pan Masala Market Size, Share and Trends 2023-2028 [Internet]. [cited 2023 Mar 30]. Available from: https://imarcgroup.com/prefeasibility-report-pan-masala-processing-plant
- Khan Z, Khan S, Christianson L, Rehman S, Ekwunife O, et al. (2016) Smokeless tobacco and oral potentially malignant disorders in South Asia: A protocol for a systematic review. Syst Rev 5(1): 142.
- Nersesyan A, Vardazaryan N, Gevorgyan A, Arutyunyan R (2022) Micronucleus level in exfoliated buccal mucosa cells of cancer Arch Oncol 10(1): 35-36.
- Kamboj M, Mahajan S (2007) Micronucleus-an upcoming marker of genotoxic damage. Clin Oral Investing 2: 121-126.
- Dindigre SL, Gosavi S, Kumawat RM, Ganvir S, Hazarey V (2012) Comparative Study of Exfoliated Oral Mucosal Cell Micronucleus Frequency in Potentially Malignant and Malignant Lesions. Int J Oral Maxillofac Pathol 3(2): 15-20.
- Casartelli G, Bonatti S, De Ferrari M, Scala M, Mereu P, et al. (2000) Micronucleus frequencies in exfoliated buccal cells in normal mucosa, precancerous lesions and squamous cell Anal Quant Cytol Histol 6: 486-492.
- Halder A, Chakraborty T, Mandal K, Gure PK, Das S, et al. (2004) Comparative Study of Exfoliated Oral Mucosal Cell Micronuclei Frequency in Normal, Precancerous and Malignant Int J Hum Genet 4: 257-260.
- Reddy KS (2008) Micronucleus Index: An Early Diagnosis in Oral Carcinoma. J Anat Soc India 57: 8-13.
- Chitroda PK, Shah TJ, Katti G, Ghali S (2011) A Correlative Study of Smokeless Tobacco-induced Lesion and Smoke-induced Leukoplakia in Various Aspects. Kailasam S, editor. J Indian Acad Oral Med Radiol 23(2): 86-91.
- Grover S, Mujib A, Jahagirdar A, Telagi N, Kulkarni P (2012) A comparative study for selectivity of micronuclei in oral exfoliated epithelial J Cytol 4: 230.
- Jyoti S, Khan S, Afzal M, Naz F, Siddique YH (2013) Evaluation of micronucleus frequency by acridine orange fluorescent staining in buccal epithelial cells of oral submucous fibrosis (OSMF) Egypt J Med Hum Genet 2:189-193.
- Saran R, Tiwari RK, Reddy PP, Ahuja YR (2008) Risk assessment of oral cancer in patients with pre-cancerous states of the oral cavity using micronucleus test and challenge assay. Oral Oncol 44(4): 354-360.
-
 Table 1
 -
Table 2
-
Table 3
-
Table 4
-
Table 5
-
Table 6


QUICK LINKS
- SUBMIT MANUSCRIPT
- RECOMMEND THE JOURNAL
-
SUBSCRIBE FOR ALERTS
RELATED JOURNALS
- International Journal of Internal Medicine and Geriatrics (ISSN: 2689-7687)
- Advance Research on Alzheimers and Parkinsons Disease
- International Journal of Radiography Imaging & Radiation Therapy (ISSN:2642-0392)
- Journal of Nursing and Occupational Health (ISSN: 2640-0845)
- Journal of Cancer Science and Treatment (ISSN:2641-7472)
- Journal of Allergy Research (ISSN:2642-326X)
- BioMed Research Journal (ISSN:2578-8892)


