
5157
Views & Citations4157
Likes & Shares
There are reports from animal model research that affirm the contribution of oxidative stress in diabetes development (both type I and II). This was linked to formation of free radical ions from protein glycation, increased lipid peroxidation and glucose oxidation leading to enzymatic destruction of cellular mechanism and insulin resistance [7]. Oxidative stress observed in diabetes mellitus principally originated from the mitochondria. In the process of mitochondrial oxidative metabolism, one fraction from used oxygen is converted to water whereas leaving other portion changing to free radical (O•) which is vital to reactive species formation, examples; OH, ONOO− and H2O2 [8]. Signaling of insulin is enhancing by two-way reaction (ROS/RNS). On first reaction, insulin responds positively in order to exercise the physiological effect [9]. This reaction leads to reactive species thus negatively modulating insulin signaling leading development of insulin resistance that is paramount to development of diabetes (mostly type II) [10].
Antioxidants reverse the oxidation triggered by reactive species resulting in cell injury [10,11]. Antioxidants like vitamins and thiols can disrupt this chain of reactions thereby preventing cell damage [11]. To counteract the damaging effect of oxidative stress, there is need to maintain both plant and animal source of antioxidants. Reports have shown that during prediabetic stage, the antioxidant system was able to mitigate injury pose by increasing free radicals, but during the diabetes proper, there is advancement in free radical generation and this was directly linked to hyperglycemia that have negative factor on the antioxidant pathway [12].
On this account, this study assessed the modulatory activities of Lawsonia inermis Linn leaves on the dynamics of oxidant and anti-oxidant biomarkers in various organs (Brain, heart, kidney and liver) predisposed to diabetic complications in STZ-induced diabetic rats.
METHODOLOGY
Plant Harvesting, Identification and Preparation
Leaves of Lawsonia inermis Linn was harvested from a farm land in Oke-oyi in Ilorin East area council of Kwara state, North Central, Nigeria. Taxonomically, it was both identified and authenticated at University of Ibadan Herbarium and a specimen was deposited and assigned a voucher number UIH-22460. The leaves were dried at room temperature (25ºC) under shade in a room for four weeks and were blended to powdery form. The powdery leaves of Lawsonia inermis Linn were extracted.
Extraction and Separation of crude Lawsonia inermis Linn leaves
3 kg of powdery leaves of Lawsonia inermis were separately soaked in 5-litre methanol for 72 hours respectively. The mixture was gently decanted and filtered. The filtrate was immediately evaporated at temp 40°C with a rotary evaporator to yield 45% crude extract.
Fractionation of crude methanolic extract of Lawsonia inermis Linn leaves
The crude methanol extract 500 g was subsequently fractionated using 1 litter N-hexane, ethyl acetate and methanol in order of increasing polarity using 5cc column silica.
Experimental animal and Ethical Consideration
This study was ethically approved by ACUREC which is the regulatory body in charge of animal use in the University of Ibadan. ACUREC issue a full approval the with assigned number: UI-ACUREC/18/0063. All stress factors such as handling, feeding, housing, environmental conditions etc. were adequately provided and the animals were humanly handled.
Experimental Animals
Male Wistar rats between 130-180g, (total 50) were used for this experiment. Experimental rats were housed using international standard and were maintained at ideal conditions under appropriate temperature and humidity. The experimental rats were fed with vital(R) feed (standard animal feed). Feed and water were provided ad libitum. The blood glucose of all the experimental rats was assessed using fine test glucometer (United Kingdom) prior to the start of the experiments.
Diabetes induction
Experimental diabetes was induced using streptozotocin (STZ) (sigma®). STZ was dissolved in distilled water and injected intraperitoneally at 65 mg/kg.
Animal grouping
Experimental rats were randomly grouped into thirteen having 4-5 rats per group and each group was treated for 28 days as thus;
Control: Normoglycaemic control treated with distil water
Diabetic untreated: Hyperglycemic controls treated with distil water.
- Diab+Li+Meth-50 mg/kg: Diabetic and treated at a dosage 50 mg/kg methanol extract of Lawsonia inermis Linn. leave
- Diab+Li+Meth-100 mg/kg: Diabetic and treated at a dosage 100 mg/kg methanol extract of Lawsonia inermis Linn. leave
- Diab+Li+Nx-50 mg/kg: Diabetic and treated at a dosage 50 mg/kg N-hexane extract of Lawsonia inermis Linn. leave
- Diab+Li+Nx-100 mg/kg: Diabetic and treated at a dosage 100 mg/kg N-hexane extract of Lawsonia inermis Linn. leave
- Diab+Li+EA-50 mg/kg: Diabetic and treated at a dosage 50 mg/kg Ethyle acetate extract of Lawsonia inermis Linn. leave
- Diab+Li+EA-100 mg/kg: Diabetic and treated at a dosage 100 mg/kg Ethyle acetate extract of Lawsonia inermis Linn leave
- Diab+Metformin: Diabetic and treated at a dosage of 500 mg/kg metformin.
- Diab+Gliben: Diabetic and treated at a dosage 50 mg/kg glinbencamide.
Constitution and Administration of Lawsonia inermis leave extract
The stock concentration of the three extract were prepared by mixing 2ml of distil water to 0.5g of extract so as to dissolve it. These preparations were administered orally at different doses indicated above of the rats in the test groups for 4 weeks. The control groups were treated using distill water.
The oxidative stress markers were analyzed using commercial Elisa test kits such as GST, GSH, GST, GPx, MPO, H2O2 MDA, protein thiol and SOD from the brain, liver, kidney, heart and serum.
Preparation of tissues homogenate (brain, heart, kidney and liver)
Brain, heart, kidney and liver were removed and cut from the fat and connective tissue. They were all weighed individually and immediately perfused with normal saline. The tissues were homogenized separately with Potassium Phosphate Buffer (KPB) using a homogenizer (Teflon, UK). The tissue homogenate from these various organs was subsequently centrifuged at 10000 rpm for 15 min using a cold centrifuge (Sipha USA) at 4˚C. Post Mitochondrial Fraction (PMF) was obtained and decanted using a disposable pipette. The PMF supernatant was used for the assaying GSH, SOD, GPx, GST, Protein Thiol and Total Protein. Other assays were H2O2, NO, MDA and MPO content.
RESULTS
Glutathione Peroxidase (GPx)
The mean value of brain GPx in the untreated diabetic group decreased (201.77±76.26) significantly (p<0.05) when compared to all other treatment groups and normoglycaemic control. The brain GPx of group Meth-100 mg/kg (230.31±43.61) showed a non-significant decreased level while all other treatment groups increased non-significantly compared to normoglycaemic control (250.52±46.51) (Table 1).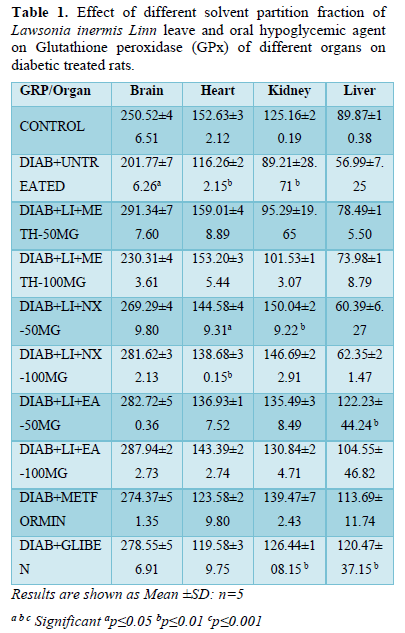
The GPx of the heart also followed a similar trend decreasing significantly (p<0.01) in groups Nx-50mg/kg (144.58±49.31), Nx-100 mg/kg (138.68±30.15) and diabetic untreated (116.26±22.15). All other treatment groups showed non-significant decreased levels except Meth-50 mg/kg (159.01±48.89) that increased non-significantly when compared to normoglycaemic control (Table 1).
The kidney GPx increased significantly (p<0.05) in groups Nx-50mg/kg (150.04±29.22) and glibenclamide (126.44±108.15) while it decreased significantly in diabetic untreated (89.21±28.71) compared to normoglycaemic untreated (125.16±20.19).
All treatment groups showed significant (p<0.01) increased liver GPx level when compared to hyperglycemic control (56.99±7.25). There is a significant (p<0.05) increased GPx level in groups EA-5 0mg/kg (122.23±44.24) and Glibenclamide (120.47±37.15) when compared to all other treatment groups and both Hyperglycemic (56.99±7.25) and normoglycaemic (89.87±10.38) controls (Table 1).
Glutathione (GSH)
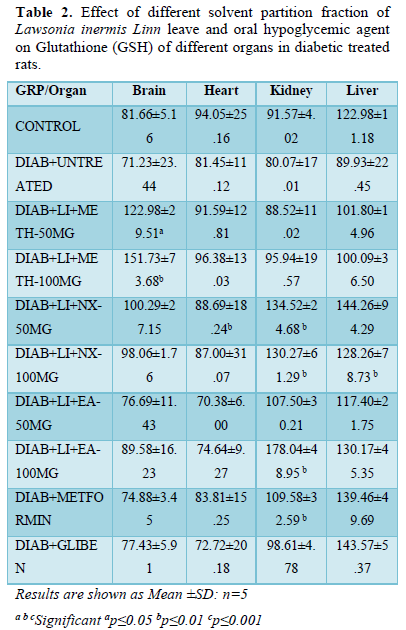
The brain GSH presented significant (p<0.01) increased level in groups; Meth-50 mg/kg (122.98±29.51) and Meth-100 mg/kg (151.73±73.68) while groups Nx-50 mg/kg (100.29±27.15) Nx-100 mg/kg (98.06±1.76) and EA-50 mg/kg (89.58±16.23) increased non-significantly. All other treatment groups and hyperglycemic control showed non-significant decreased GSH level when compared to normoglycaemic control (81.66±5.16).
In heart, mean GSH level increased significantly (P≤0.05) in Nx-50 mg/kg (88.69±18.24) while non-significant increased level is seen in groups Meth-100 mg/kg (96.38±13.03). All other treatment groups and hyperglycemic untreated control presented non-significant decreased GSH level when compared to non-diabetic untreated control (94.05±25.16).
The kidney GSH increased significantly (p<0.01) in groups Nx-50 mg/kg (134.52±24.68), Nx-100 mg/kg (130.27±61.29), EA-100 mg/kg (178.04±48.95) and metformin (109.58±32.59) while it increased non-significantly in other treatment groups where it decreased non-significantly when compared to normoglycaemic untreated (91.57±4.02).
All treatment groups showed significant (p<0.01) increased liver GSH level when compared to hyperglycemic control (89.93±22.45). There is significant (p<0.05) increased GSH level in groups Nx-100 mg/kg (128.26±78.73). All other treatment groups showed non-significant increased or decreased GSH level (liver) when compared normoglycaemic (122.98±11.18) controls (Table 2).
Glutathione s-transferase (GST)
GST of brain presented a significant (p<0.01) decreased level in all treatment groups except Nx- 100 mg/kg that decreased (3.95±0.40) non-significantly increase compared to non-diabetic control (4.22±1.42). All treatment groups showed significant increased GST level when compared to hyperglycemic untreated control (2.39±2.07).
In the heart, GST followed the same trend as observed in the brain showing significant (p<0.01) decreased level in all treatment groups except Glibenclamide (2.15±1.93) that presented non-significant decreased level compared to non-diabetic control (3.62±1.35). Like in the brain, heart GST of all treatment groups increased significantly when compared to hyperglycemic untreated control (1.03±0.51).
GST of the kidney decreased significantly (p<0.05) in diabetic untreated control (2.01±2.37) but increased significantly (p<0.05) in groups Nx-50 mg/kg (5.39±1.07), EA-50 mg/kg (5.75±1.98) and metformin (5.99±5.10) while other treatment groups decreased non-significantly when compare to non-diabetic control (5.89±0.59). It is noted that all treatment groups showed significant improvement in the level of kidney GST when compared to diabetic untreated control (2.01±2.37).
GST of the liver decreased significantly (p<0.05) in diabetic untreated control (2.48±2.21) compared to all treatment groups and normoglycaemic control. All treatment groups showed significant (p<0.01) increased GST level except groups Nx-50 mg/kg (3.02±1.65) and Nx-100 mg/kg (4.74±6.04) that decreased significantly (p<0.01) when compared to normoglycaemic untreated control (6.44±1.98) (Table 3).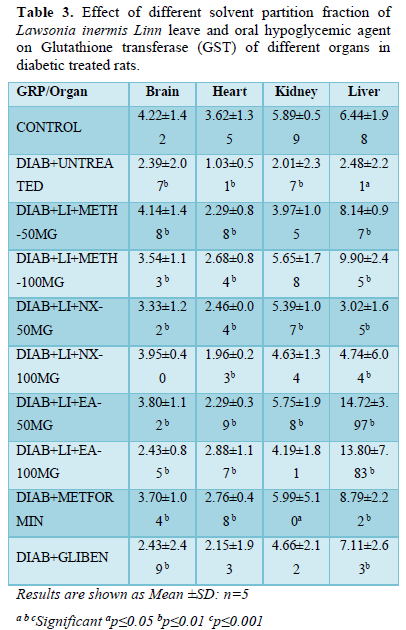
Superoxide Dismutase (SOD)
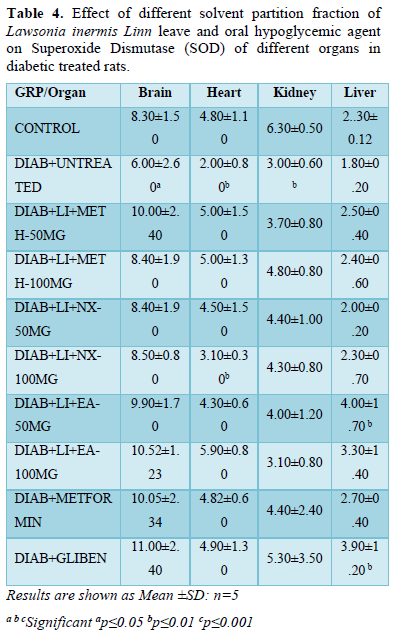
SOD in brain of hyperglycemic untreated rats (6.00±2.60) present a significant (p<0.05) decreased level when compared to all treatment groups and normoglycaemic control (8.30±1.50). All treatment groups showed non-significant increase SOD level in the brain compared to normoglycaemic control (8.30±1.50).
Like brain SOD, similar observation was noticed in the heart where the level of SOD decreased significantly (p<0.01) in untreated diabetic group (2.00±0.80) compared to all treatment groups and non-diabetic control. All treatment groups showed non-significant increased SOD level except Nx-100 mg/kg (3.10±0.30) that decreased significantly (p<0.01) compared to other treatment groups and normoglycaemic control (4.80±1.10).
SOD in kidney followed the same trend where it decreased significantly (p<0.01) in untreated diabetic group (3.00±0.60) when compared to all treatment groups and non-diabetic control (6.30±0.50). Kidney SOD level in all treatment groups decreased non-significantly compared to normoglycaemic control (6.30±0.50).
Liver SOD increased significantly (p<0.01) in groups; EA-50 mg/kg (4.00±1.70) and glibenclamide (3.90±1.20). All other treatment groups increased non-significantly except Nx-50 mg/kg (2.00±0.20) that decreased non-significantly compared to normoglycaemic control (2.30±0.12) (Table 4).
Protein thiol
Protein thiol in brain of metformin treated group (74.71±18.58) showed significant (p<0.001) increased level compared to other treatment groups and normoglycaemic control (52.72±8.19).
All treatment groups showed significant (p<0.05) increased brain protein thiol level compared to hyperglycemic untreated control (40.14±26.61). Brain protein thiol level of groups treated with methanol fraction decreased non-significantly while other two fractions and glibenclamide increased non-significantly when compared to normoglycaemic control.
Protein thiol level in the heart of glibenclamide treated group showed significant (p<0.001) increased level when compared to other treatment groups and non-diabetic control (70.81±19.0). EA-100 mg/kg (68.30±4.91) showed significant (p<0.01) decreased thiol level when compared to other treatment groups while other treatment groups did not show significant alteration compared to normoglycaemic control.
The protein thiol in the kidney presented significant (P<0.01) increased level in groups Nx-50 mg/kg (111.68±47.83), EA-50 mg/kg (108.28±33.65), Metformin (111.15±21.32) and Glibenclamide (119.01±51.68) while other treatment groups increased non-significantly compared to diabetic (75.13±16.49) and non-diabetic (83.79±24.57) control.
Protein thiol in the liver increases in all treatment groups with significant (p<0.01) increased level in groups; N-hexane treated groups when compared to other treatment groups, diabetic control (104.12±45.09) and normoglycaemic control (115.06±24.25) (Table 5).
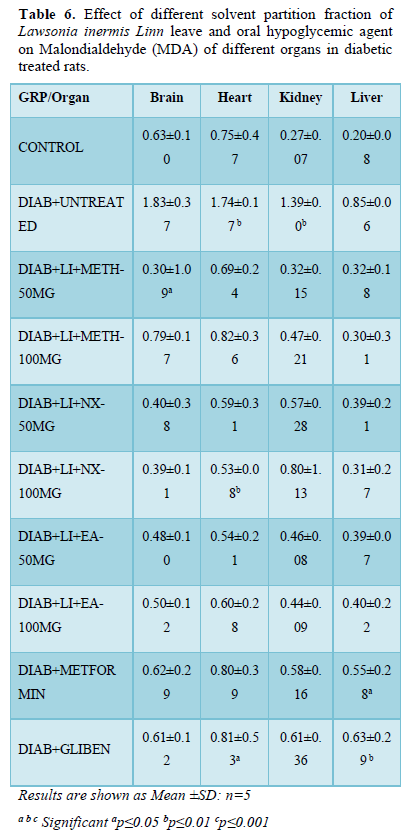
Malondialdehyde (MDA)
MDA in brain increased significantly (p<0.01) in diabetic untreated rats (1.83±0.37) compared to all treatment groups and normoglycaemic control (0.63±0.10). All treatment groups present non-significant decreased brain MDA level except Meth-50 mg/kg (0.30±1.09) that decrease significantly (p<0.05) when compared and normoglycaemic controls.
The MDA in heart of groups Glibenclamide (0.81±0.53) and hyperglycemic untreated rats (1.74±0.17) increased significantly (p<0.01) when compared to other treatment groups and normoglycaemic control. MDA level in the heart of group; N-hex-100 mg/kg (0.53±0.08) decreased significantly (p<0.05) compared to other treatment groups and normoglycemic control. Other treatment groups did not show significant alteration in the heart MDA when compared to normoglycaemic control but decreased significantly compared to hyperglycemic control.
The MDA in the kidney showed similar trend increasing significantly (p<0.05) in diabetic untreated rats (1.39±0.0) when compared to all treatment groups and non-diabetic control (0.27±0.07). There was significant alteration in kidney MDA in all treatment groups increasing non-significantly when compared to normoglycaemic control.
In liver; the MDA level significantly (p<0.01) decreased in treatment groups Metformin (0.55±0.28) and glibenclamide (0.63±0.29) compared to other treatment groups and normoglycemic control (0.20±0.08). Other treatment groups and hyperglycemic untreated group presented non-significant decreased liver MDA level when compared to normoglycaemic control (Table 6).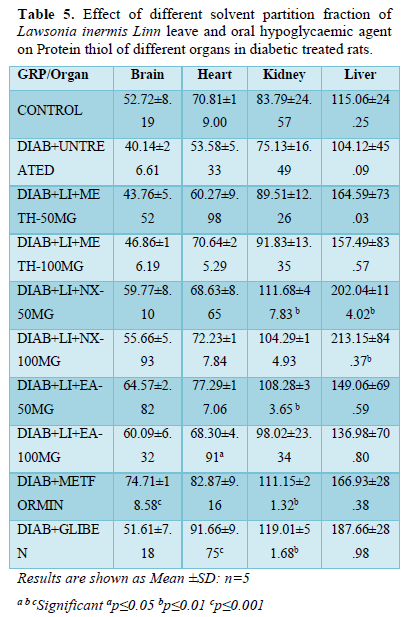
Hydrogen peroxide (H2O2)
The brain of diabetic untreated rats (56.09±12.91) had significant (p<0.01) increased H2O2 level compared to other treatment groups and non-diabetic control (47.31±15.31). All treatment groups showed non-significant decreased H2O2 level except groups; Nx-50mg/kg (48.53±6.49) and glibenclamide (48.45±21.27) that increased non-significantly compared to normoglycaemic control.
H2O2 in heart of diabetic rats increased non-significantly while it decreased in other treatment groups compared with non-diabetic control (60.03±16.07). All other treatment groups did not show significant alteration when compared to both diabetic and non-diabetic controls.
H2O2 in kidney followed the same trend increasing non-significantly in diabetic untreated rats (105.23±13.35), metformin (98.84±22.51) and glibenclamide (96.89±37.15) while it decreased non-significantly in other treatment groups when compared to normoglycaemic control (94.25±19.11).
In the liver, H2O2 level of diabetic untreated rats (127.51±19.83) increased non-significantly compared to non-diabetic control and all other treatment groups. There is non-significant increased or decreased level of liver H2O2 in all the treatment groups when compared to normoglycaemic control (102.28±44.83) (Table 7).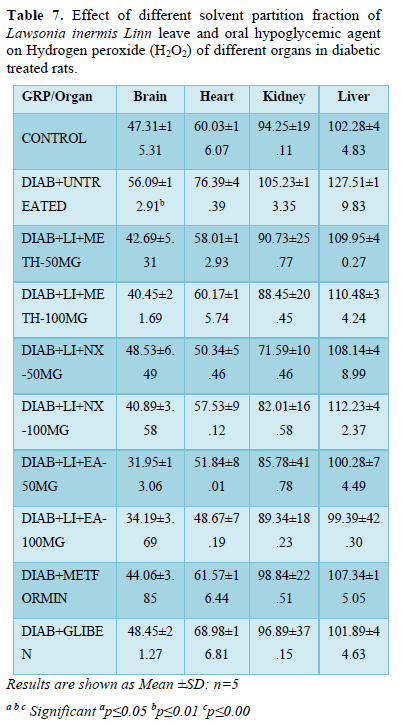
Nitric oxide (NO)
Untreated hyperglycemic group showed a significant (p<0.001) increased NO expression when compared to all other treatment groups and the normoglycemic control. EA-100mg/kg presented a significant reduction in No expression when compared to other treatment group and hyperglycemic control. Methanol fraction reduced No expression just like the two standard drugs (Figure 1).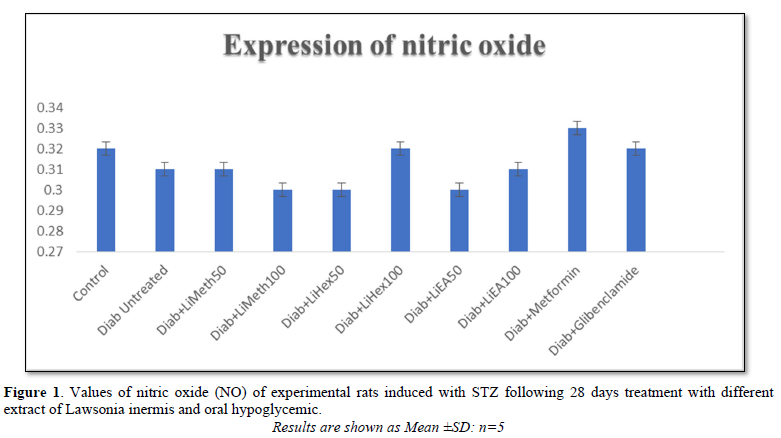
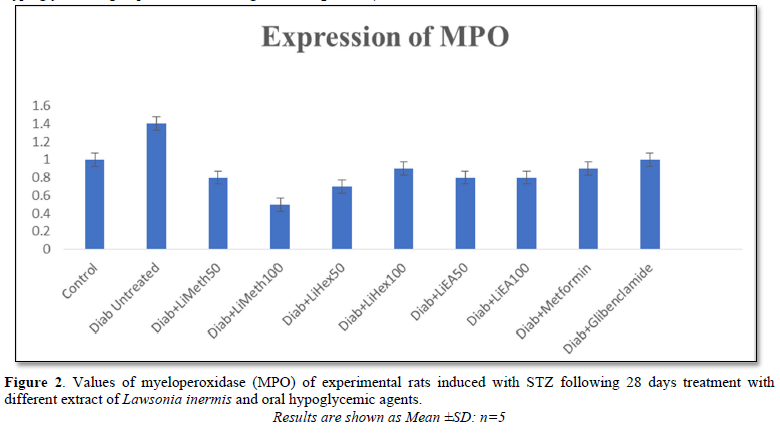
Myeloperoxidase (MPO)
Increased expression of MPO usually increase the risk of cardiovascular complication in DM. Untreated hyperglycemic group showed a significant (p<0.001) increased MPO level when compared to all other treatment groups and the normoglycemic control. All extract treated groups presented a significant decreased in the level of MPO when compared to normoglycemic control (Figure 2).
DISCUSSION
Streptozotocin (STZ) is a cytotoxic compound that is mediated by reactive oxygen species (ROS) which penetrates the β-cells via glucose transporter. The resultant oxidative stress leads to DNA strand breakage in β-cells causing decreased endogenous insulin release [13].
Oxidative stress which is imbalance between oxidant (reactive oxygen species) and anti-oxidant cascade [14]. Free radicals are mostly generated in many metabolic diseases including diabetes and this result in oxidative stress which leads to ineffective natural antioxidant system that subsequent result to free radical accumulation [15]. Reports on diabetes studies showed that oxidative stress destroys β-cells leading to altered insulin production, release and functions [16]. The oxidant markers used in this study are Malondialdehyde (MDA), Hydrogen peroxide (H2O2), Nitric oxide (NO) and myeloperoxidase (MPO). The MDA and H2O2 were assayed in the brain, heart, kidney and liver while MPO and NO were assayed from the serum. The anti-oxidant markers include GPx, GSH, SOD, and Protein thiol. The GPx, GSH, GST, SOD and PT were assayed from various organs predisposed to diabetic complications. The result from this study showed that diabetic untreated rats have significant increased oxidant markers (MDA, H2O2, NO and MPO) and significant decreased anti-oxidant markers (GPx, GSH, GST, SOD and PT) in all the tissues (brain, heart, kidney and liver) when compared to treatment groups and normoglycemic control. Reports have shown that the rate of oxidative stress in diabetes patients is high when compared to normal metabolic conditions [17].
The groups treated with Lawsonia inermis Linn showed a promising improvement to both oxidant and anti-oxidant markers by decreasing and increasing them respectively across different fractions in all the tissues. The MDA of the heart and kidneys in N-hexane at 100 mg/kg showed a significant reduction when compared with other treatment groups and non-diabetic control. The H2O2 of the rats treated with oral hypoglycemic drugs increases non-significantly while it decreases in other treatment groups with ethyl acetate fraction which reduced significantly when compared with normoglycaemic control group. MPO reduced significantly in both the extract and standard drugs treatment compared with both diabetic and non-diabetic control. The result obtained from this study followed consistently with the report of [18] who confirms significant decreased free radical level in alloxan induced diabetic rats treated with Lawsonia inermis Linn [18].
Glutathione S-transferases; an enzyme that catalyzes addition of tripeptide glutathione to endogenous and exogenous substrates with electrophilic functional group. It plays a crucial role in metabolism and detoxification of xenobiotic pathway acting as potent endogenous anti-oxidant [19]. This present study showed Lawsonia inermis Linn improved the anti-oxidant system in all the marker of both serum and tissues. The body defense mechanisms used anti-oxidant system as remedy to mope up free radicals [20]. GSH of liver was higher in Ethyl acetate treatment when compared to other treatment groups. GST followed the same trend as observed in all the tissues showing significant increase level. SOD increased across all the tissues when compared with hyperglycemic control. This agrees with work of [18,20] who report the increment in the SOD of diabetic Rattus norvegicus when treated with Lawsonia inermis Linn [18]. The protein thiol in the kidney also increased in treatment both methanol and ethyl acetate fraction when compared with other treatment groups. NO that can both act as oxidant and anti-oxidant presented the reverse case in the treatment groups decreasing significantly in all the fractions when compared to diabetic untreated control.
Increased activities of the various anti-oxidants in the serum, brain, heart, kidney and liver serves as a potent defense mechanism that detoxify or neutralize toxic metabolites inform of ketone bodies that is produced by hepatic cell in diabetes mellitus. Surge in the activities of the anti-oxidant effectively normalize the abnormal impairment posed by STZ induced-diabetes [21]. Effective antioxidant system may be helpful in delaying diabetic complication such as retinopathy, nephropathy and neuropathy which arise due to imbalance between the oxidant and antioxidant system in the body [22].
In conclusion, fractions of Lawsonia inermis possess a significant positive modulatory activity by improving the antioxidant system which may be helpful in delaying diabetic complications.
COMPETING INTEREST
This research did not receive any specific grant from funding agencies in the public, commercial or not-for-profit sectors.
- Guariguata L, Whiting D, Weil C, Unwin N (2011) The International Diabetes Federation diabetes atlas methodology for estimating global and national prevalence of diabetes in adults Diabetes Res Clin Pract 94(3): 322-332.
- World Health Organization (2010) Diabetic and its complication fact sheet 208.
- Bansal AK, Bilaspuri GS (2011) Impacts of oxidative stress and antioxidant on semen functions. Vet Med Int 2010: 686137.
- Phaniendra A, Jestadi DB, Periyasamy L (2015) Free radical: Properties targets and their implication in various diseases. Indian J Clin Biochem 30(1): 11-26.
- Turrens JF (2003) Mitochondrial formation of reactive species. J Physiol 552(2): 335-344.
- Pharm-Huy LA, He H, PharmHuy C (2008) Free radicals, antioxidant in diseases and health. Int J Biomed Sci 4(2): 89-96.
- Maritim AC, Sanders RA, Watkin JB (2003) Diabetes oxidative stress and antioxidants: A review. J Biochem Mol Toxicol 17: 24-38.
- Raedschelders K, Ansley DM, David DY, Chen AB (2012) The cellular and molecular origin of reactive oxygen species generation during myocardial ischemia and reperfusion. Pharmacol Ther 133(2): 230-255.
- Afanas'ev I (2010) Signaling of reactive oxygen and nitrogen species in Diabetes mellitus. Oxid Med Cell Longev 3(6): 361-373.
- Erejuwa OO (2012) Oxidative stress in diabetes is there a role of hypoglycemic drugs or/Antioxidant. Molecules 17(4): 4400-4423.
- Pizzino G, Irrera N, Cucinotta M, Pallio G, Mannino F, et al. (2017) Oxidative Stress: Harms and benefits for human health. Oxid Med Cell Longev 2017: 8416763.
- Matough FA, Budin AB, Hamid ZA, Alwahaibi N, Mohamed J (2012) The Role of Oxidative Stress and Antioxidants in Diabetic Complications. Sultan Qaboos Univ Med J 12(1): 5-18.
- Irudayaraj SS, Sunil C, Duraipandiyan V, Ignacimuthu S (2012) Antidiabetic and antioxidant activities of Toddalia asiatica (L.) Lam. Leaves in Streptozotocin induced diabetic rats. J Ethnopharmacol 143: 515-523.
- Kurkcu R (2010) The effects of short term exercise on the parameters of oxidant and antioxidant system in handball players. Afr J Pharm Pharmacol 4(7): 448-452.
- Baynes JW, Thorpe SR (1999) Role of oxidative stress in diabetic complications Diabetes. J Diabetes 48: 1-9.
- Sheikhpour R (2013) Diabetes and Oxidative Stress: The Mechanism and Action. Iran J Diabetes Obes 5(1): 40-45.
- Sunyoto A (2015) Pengaruh Pemberian Campuran Bee Pollen Rimpang Kencur Kunyit Biji Pinang dan Kayu Manis Terhadap Kadar Gula Darah pada Tikus Wistar Pasca Paparan Streptozotocin. The 2nd University Study Coloquium, pp: 389-398.
- Antika MA, Ilyas S, Sari MI (2017) Effects of Lawsonia inermis Linn. Ethanol extract on the superoxide dismutase activity in hyperglycemic Rattus norvegicus. Indones J Med 2(2): 79-85.
- Ji X, Zhang P, Armstrong RN, Gilliland GL (1992) The three dimensional structure of a glutathione S-transferase from the Mu gene class. Structural analysis of the binary complex of isoenzyme and glutathione at Å of resolution. Biochemistry 31: 10169-10184.
- Astuti S, Muchtadi D, Astawan M, Purwantara B, Wresdiyati T (2009) Pengaruh Pemberian Tepung Kede-lai Kaya Isoflavon Terhadap Kadar Malondialdehid MDA Aktivitas Superoksida Dismutase (SOD) Testis.
- Kumar V, Ahmed D, Gupta PS (2013) Anti diabetic anti-oxidant and anti hyperlipidemic activities of Melastoma malabathricum Linn leaves in streptozotocin induced diabetic rats. BMC Complement Altern Med 13: 222.
- Ojewumi OO, Oshodi T, Ogundele IO, Micah C, Adenekan S (2014) In vitro antioxidant and antihyperlipidemic activities of ethanolic extract of Lawsonia inermis Linn Br J Pharm Res 4(3): 301-314.
-
 Table 1
 -
Table 2
-
Table 3
-
Table 4
-
Table 5
-
Table 6
-
Table 7


QUICK LINKS
- SUBMIT MANUSCRIPT
- RECOMMEND THE JOURNAL
-
SUBSCRIBE FOR ALERTS
RELATED JOURNALS
- Journal of Psychiatry and Psychology Research (ISSN:2640-6136)
- Archive of Obstetrics Gynecology and Reproductive Medicine (ISSN:2640-2297)
- International Journal of Internal Medicine and Geriatrics (ISSN: 2689-7687)
- Journal of Cancer Science and Treatment (ISSN:2641-7472)
- Journal of Neurosurgery Imaging and Techniques (ISSN:2473-1943)
- Journal of Blood Transfusions and Diseases (ISSN:2641-4023)
- Journal of Nursing and Occupational Health (ISSN: 2640-0845)


