
22771
Views & Citations21771
Likes & Shares
N=PQ/(E/1.96)2
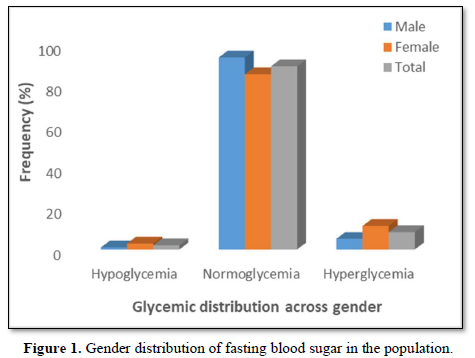
A total of 2.0 % of the participants (1.0 % males, 2.9 %females) had hypoglycemia (FBS < 54 mg/dl), 89.5 % of theparticipants (93.8 % males, 85.6 % females) werenormoglycemic (FBS = 54-90 mg/dl) while 8.5 % of theparticipants (5.2 % males, 11.5 % females) werehyperglycemic (FBS > 90 mg/dl but < 126 mg/dl) (Figure1).
Furthermore, the optimal cut points in the ROC curve which maximizes the sensitivity and specificity of the test was determined (Table 5).

DISCUSSION
Prevalence of FINDRISC components
The FINDRISC tool is scored by a cluster of eight components that are thought to be risk factors for diabetes mellitus [4]. The prevalence of these components contributes significantly to diabetes risk profiles in the population. We thus considered significant differences in the prevalence and values of risk factors across gender.
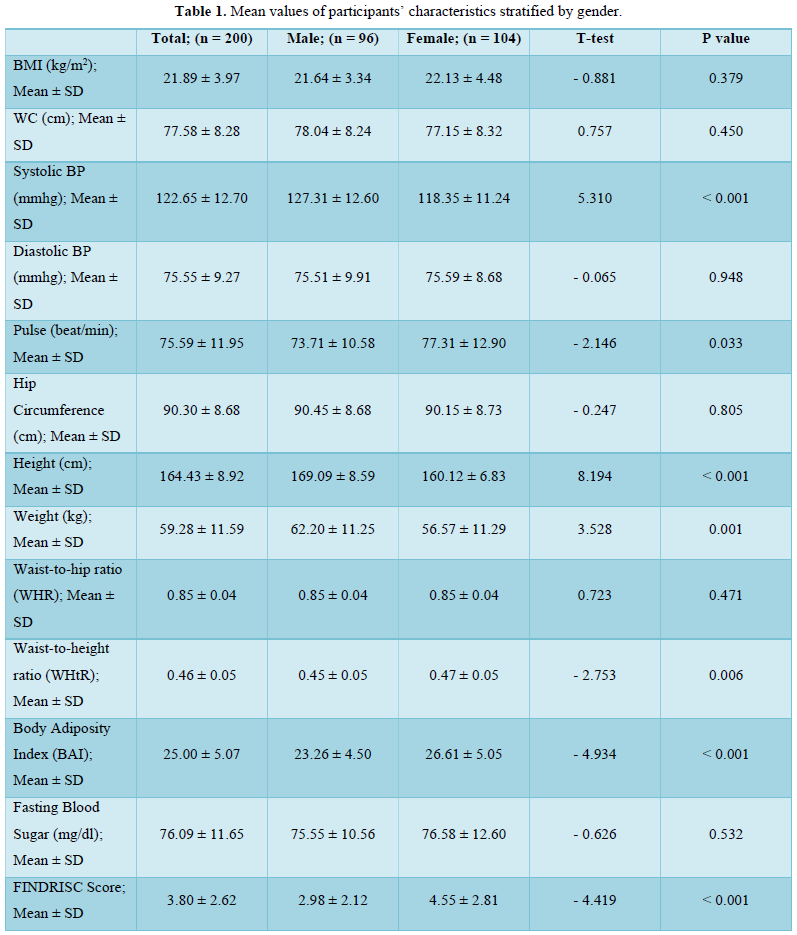
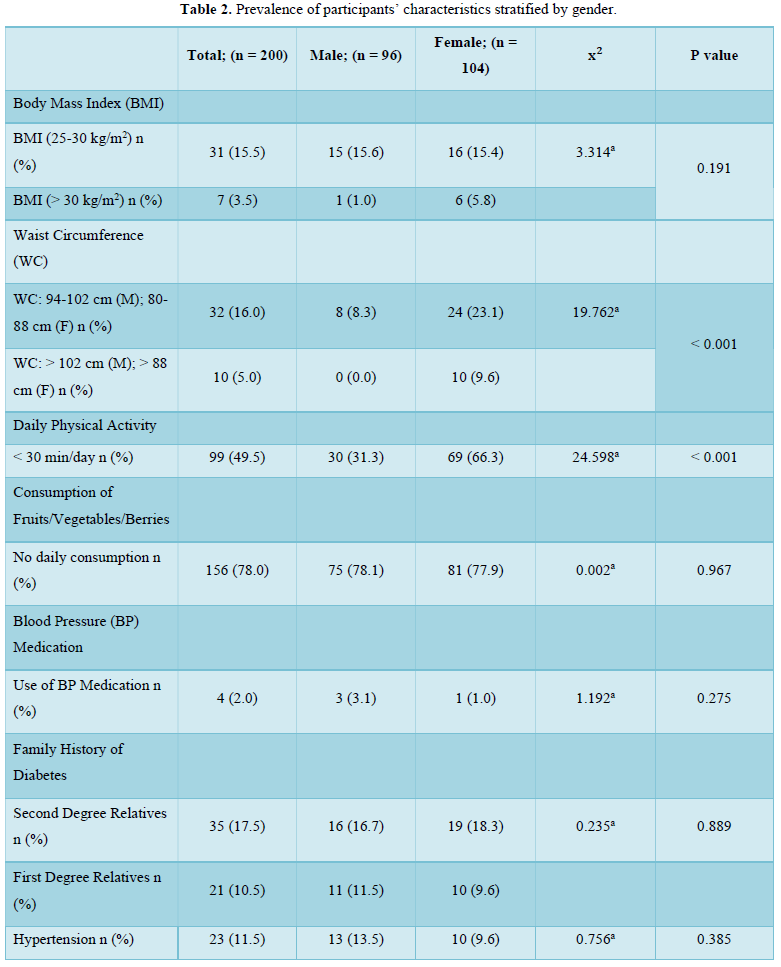
In this present study, there was a 16.0 % and 5.0 % prevalence of overweight and obesity (by waist circumference) respectively, with a female preponderance of participants who attained the threshold values for elevated waist circumference. Taken together, the prevalence of overweight/obesity in this study nearly approximates using either waist circumference (21.0 %) or BMI (19.0 %) as the diagnostic index. This is because we also found an overweight and obesity prevalence of 15.5 % and 3.5 % respectively, using BMI as the diagnostic index. There was no significant difference in the prevalence of overweight (15.6 % vs 15.4 %) and obesity (1.0 % vs 5.8 %) in males compared to females. Our figures agree with the 3.6 % obesity prevalence reported recently amongst young adults in a tertiary health institution in South-West Nigeria [14] and also compares with the 13.4 % overweight and 6.5 % obesity reported in a young adult population in South-Eastern Nigeria [15]. However, our figures are lower than the 22 % overweight but higher than the 4 % obesity reported in an earlier study involving rural and urban adults in Benue state [16]. Our figures are also lower than the 28.0 % overweight and 10.9 % obesity recently reported in a rural community in South East Nigeria [17]. The age of our study population (young adults) may have accounted for these differences as overweight and obesity prevalence increases with age [18].
The higher prevalence of overweight and obesity in female participants is a recurring decimal in Nigerian populations [19,20]. This may not be unconnected with factors such as lack of physical exercise, involvement in less strenuous and physically tasking activities, poor participation in sports due to cultural and societal considerations [21] as well as gender differences in metabolism and hormonal balance [22,23]. This justifies the significantly (p < 0.001) higher prevalence of a lack of physical activity in the population (49.5 %) with a higher prevalence in female participants (66.3 % vs 31.3 %) compared to the male participants in this study. Generally, urbanization is associated with a drastic decline in the rate of physical activity while a preponderance of sedentary activity is associated with a higher risk of overweight and obesity [24]. Clearly, this urbanized sedentary lifestyle is gradually becoming evident in rural settings. This presents a double jeopardy specifically for the young adult females in the population since excess weight and a lack of physical activity are important non-genetic factors responsible for the increasing cases of diabetes mellitus [25,26]. Additionally, it is worrying that, the 66.3 % prevalence of a “less than 30 min of daily physical activity” amongst female young adults in the study population is higher than the 38.5 % prevalence reported amongst civil servants in South-Eastern Nigeria [25] and 11.6 % reported in an earlier study in Kaduna [27]. The fact that a lack of physical activity is a risk factor for type 2 diabetes mellitus [28] and a reduction of sedentary time via physical exercise can improve lipid metabolism and blood glucose control for the prevention and treatment of type 2 diabetes related disorders provides a valid basis for concern [29,30].
In this study, a total of 28.0 % of the participants had a family history of diabetes involving either their second degree or first-degree relatives. This is lower than a family history of 36.4 % previously reported in a Nigerian population [25]. The presence of a family history of diabetes is an important risk factor which increases the likelihood of developing type 2 diabetes mellitus [31,32]. The tendency towards subjectivity and even ignorance of accurate health information of relatives on the part of the participants may have contributed to the reported prevalence of family history of diabetes. Clearly, this is an aspect that requires further research on the best ways of eliminating possible errors due to subjectivity in order to improve the accuracy of risk prediction tools.
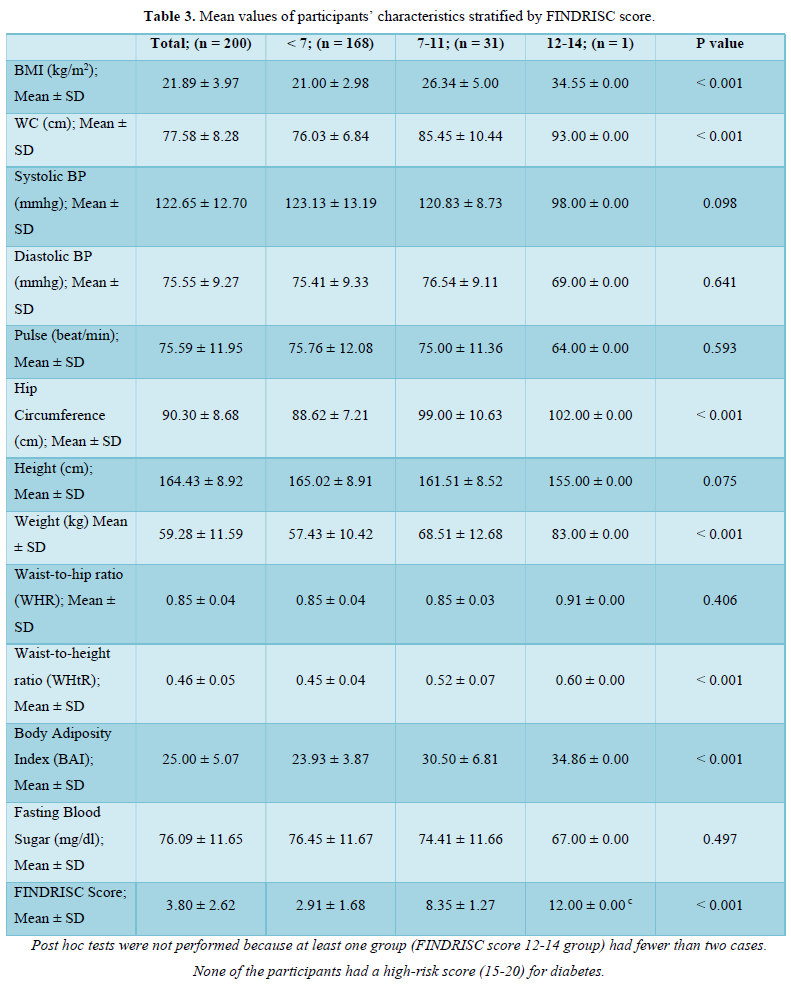
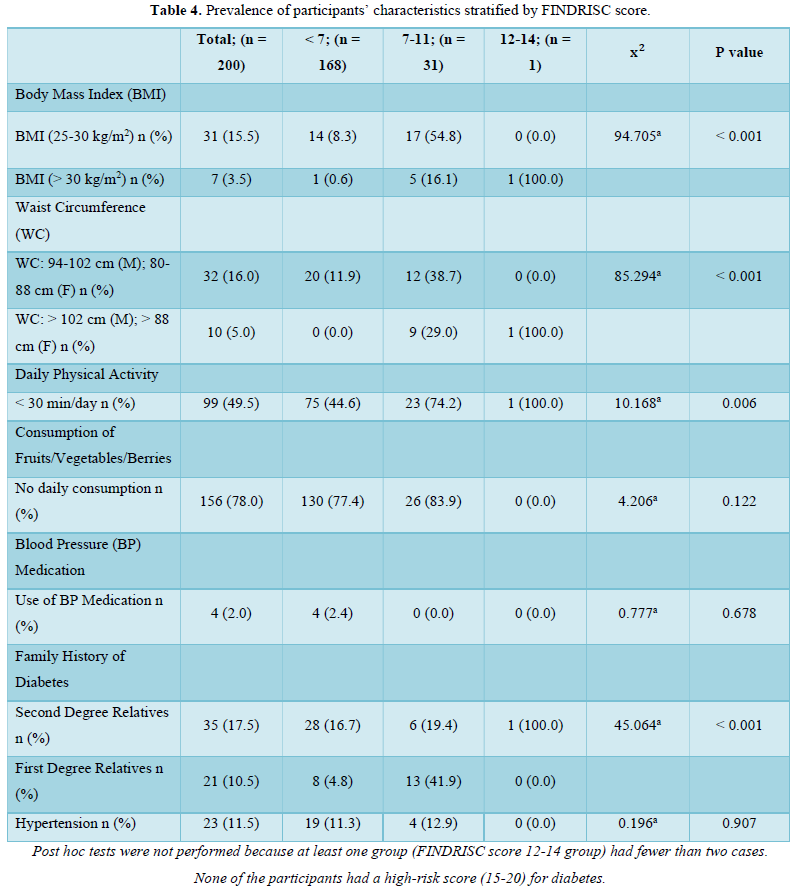
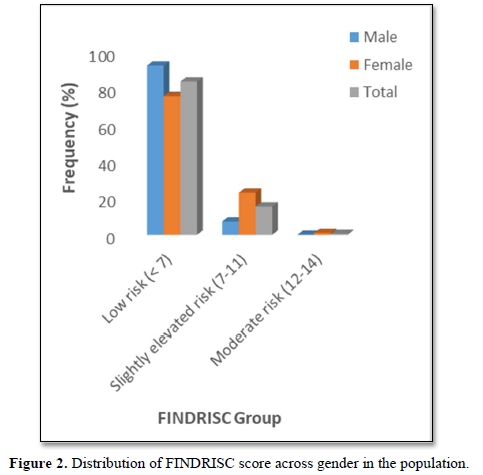
The prevalence pattern of these components is summed up in the overall risk profile. It follows that participant in the highest FINDRISC score group (FINDRISC = 12-14) in this population had the highest prevalence of risk factors. Although there were no high-risk participants, we however found that 16.0 % of the participants had a slightly elevated or moderate risk of developing diabetes with a female preponderance (24.1 % vs 7.3 %) compared to males. The absence of high risk in the population is suggestive of a reduced number and prevalence of risk factors. However, the high prevalence of slightly elevated or moderate risk of developing diabetes in the total population and specifically in females demand attention.
Although a previous diagnosis of diabetes is a high scoring component of the FINDRISC tool, we had a valid reason to exclude participants who had diabetes at baseline since the FINDRISC tool is aimed at predicting the risk of developing the disease. It is our considered opinion that there is no predictive utility derived from using a predictive tool for the prediction of an already existing condition. Indeed, using “a previous diagnosis of diabetes” as a predictor of the development of diabetes cannot be considered as a logical approach for identifying individuals at high risk for developing the disease [33]. Moreover, it has been clearly stated that cross sectional studies in which risk factors are determined in a population involving participants with and without diabetes are methodologically flawed since characteristics of people with diabetes commingle with risk factors in people without diabetes. Consequently, such studies are incapable of clearly proving that a putative risk factor predated diabetes onset [34].
Validation of diagnostic accuracy
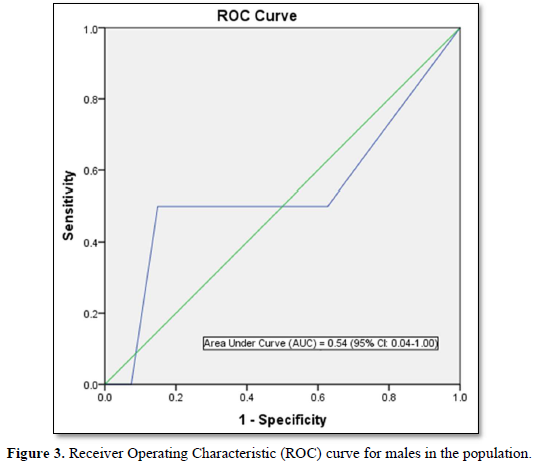
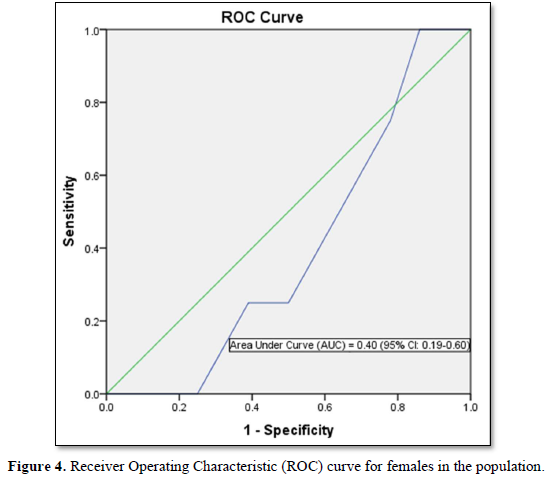
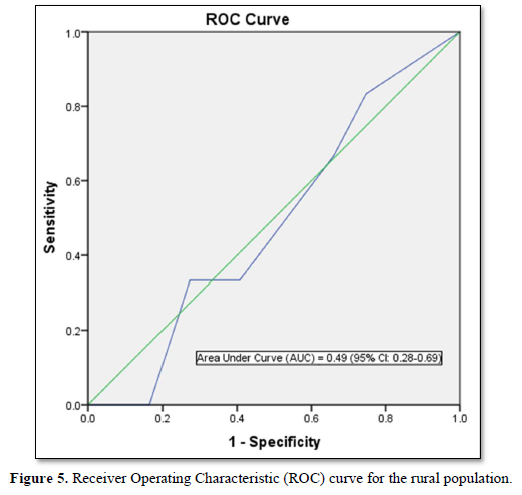
Since the FINDRISC tool was developed in Finnish cohorts, it needs to be validated in any target population using AUC of receiver operating characteristic (ROC) curves [35,36].
FINDRISC performed poorly in our study population with an AUC value of 0.49 (sensitivity 71.9 %; specificity 59.2 %) in the overall population, an AUC value of 0.54 (sensitivity 60.0 %; specificity 76.4 %) in males and an AUC value of 0.40 (sensitivity 63.6 %; specificity 60.5 %) in females. The optimal cut point was 5.5 in the overall population and male participants but 6.5 in the female participants. Generally, FINDRISC does not perform well in the diagnosis of prediabetes relative to undiagnosed type 2 diabetes mellitus and metabolic syndrome [37,36]. Our values are lower than the AUC values of 0.85 and 0.87 values in the 1987 and 1992 original Finnish cohorts respectively [4]. The AUC values of this current study implies that FINDRISC may not be accurate in the prediction of future diabetes risk in this particular young adult rural Nigerian population. Due to disparities in population characteristics, there may be need to validate the tool in other age groups, even in the same location.
STRENGTHS AND LIMITATIONS
Although our population size was not large enough, we avoided selection bias. Our sample population was fairly divided between males and females in the population. Thus, gender differences did not bias our study.
Furthermore, our choice of participants is a novelty. We studied a previously un-studied population; apparently healthy young adults, who are previously considered to be outside the at-risk group for diabetes risk assessment. We consider them to be without any chronic health complications or predisposing underlying ailments.
CONCLUSION
The FINDRISC tool performed poorly in risk prediction in the rural population. We found significant gender-based differences in the prevalence of risk factors and risk status for diabetes mellitus. Although diabetes risk susceptibility was low in the rural population, there appears to be a preponderance of risk factors and a higher risk status in female participants.
- International Diabetes Federation (IDF) Diabetes Atlas (2019) Brussels, Belgium: International Diabetes Federation. Available online at: https://www.diabetesatlas.org
- Nnamudi AC, Orhue NEJ, Ijeh II (2020) Assessment of the FINDRISC tool in predicting the risk of developing type 2 diabetes mellitus in a young adult Nigerian population. Bull Natl Res Cent 44:
- World Health Organization (2016) Global Report on Diabetes. Part 1 Global burden of diabetes. Geneva World Health Organization.
- Lindström J, Tuomilehto J (2003) The diabetes risk score: a practical tool to predict type 2 diabetes risk. Diabetes Care 26: 725-731.
- Alebiosu OC, Familoni OB, Ogunsemi OO, Raimi TH, Balogun WO, et al. (2013) Community based diabetes risk assessment in Ogun state Nigeria World Diabetes Foundation project 08-321). Indian J Endocrinol Metab 17: 653-658.
- Agu U, Agu MC, Nnaji GA (2015) Assessment of risk of developing diabetes mellitus among local government employees in Onitsha, south-eastern Nigeria. Epidemiol Rep 3:
- Vaughan JP, Morrow RH (1989) Manual of Epidemiology for District Health Management. WHO. Geneva pp: 126-128.
- Oguoma VM, Nwose EU, Skinner TC, Digban KA, Onyia IC, et al. (2015) Prevalence of cardiovascular disease risk factors among a Nigerian adult population relationship with income level and accessibility to CVD risks screening. BMJ Public Health 15: 397.
- Bergman RN, Stefanovski D, Buchanan TA, Sumner AE, Reynolds JC, et al. (2011) A Better Index of Body Adiposity. Obesity Silver Spring 19: 1083-1089.
- American Diabetes Association (2018) Standards of Medical Care in Diabetes. Diabetes Care 41: S1-S159.
- World Health Organization WHO (2000) Obesity preventing and managing the global epidemic. Report of a WHO Consultation. WHO Tech Rep Ser 894: 1-253.
- Gallagher D, Heymsfield SB, Heo M, Jebb SA, Murgatroyd PR, et al. (2000) Healthy percentage body fat ranges an approach for developing guidelines based on body mass index. Am J Clin Nutr 72: 694-701.
- Deng WW, Wang J, Liu MM, Wang D, Zhao Y, et al. (2013) Body Mass Index Compared with Abdominal Obesity Indicators in Relation to Prehypertension and Hypertension in Adults: The CHPSNE Study. Am J Hypertens 26: 58-67.
- Ezeh EC, Kadiri S (2020) Blood Pressure Hypertension and Obesity in Young Adults in a Tertiary Health Institution in Southwest Nigeria. Afr J Biomed Res 23: 81-84.
- Ukegbu PO, Uwaegbute AC, Echendu CA, Ejike C, Elekeh AJU, et al. (2017) Obesity and associated factors in young adults attending tertiary institutions in South-Eastern Nigeria.South Afr J Clin Nutr 30: 43-48.
- Sola AO, Steven AO, Kayode JA, Olayinka AO (2011) Underweight overweight and obesity in adults Nigerians living in rural and urban communities of Benue State. Ann Afr Med 10: 139-143.
- Ijoma UN, Njoku PO, Arodiwe EB, Ijoma CK (2020) Increasing Trend of Overweight and Obesity in a Rural Community in South East Nigeria. Open J Epidemiol 10: 323-333.
- Chooi YC, Ding C, Magkos F (2019) The epidemiology of obesity. Metabolism 92: 6-10.
- Akarolo Anthony SN, Willett WC, Spiegelman D, Adebamowo CA (2014). Obesity epidemic has emerged among Nigerians. BMC Public Health 14:
- Ogunlade O, Asafa MA (2015) Pattern and Prevalence of Underweight Overweight and Obesity Among Young Adult Nigerians. Am J Biomed Life Sci 3: 12-15.
- Nnamudi AC, Orhue NEJ, Ijeh II (2020) Assessment of the Levels of Cardiovascular Risk Markers in Hyperglycemic Young Nigerian Adults. Eur J Biol Biotechnol 1: 1-7.
- Cameron N, Getz B (1997) Sex differences in the prevalence of obesity in rural African adolescents. Int J Obes Relat Metab Disord 21: 775-782.
- Wisniewski AB, Chernausek SD (2009) Gender in childhood obesity family environment hormones and genes. Gend Med 6: 76-85.
- Nurwanti E, Hadi H, Chang JS, Chao JC, Paramashanti BA, et al. (2019) Rural Urban Differences in Dietary Behavior and Obesity Results of the Riskesdas Study in 10-18-Year-Old Indonesian Children and Adolescents. Nutrients 11: 2813.
- Agu U, Agu MC, Nnaji GA (2015) Assessment of risk of developing diabetes mellitus among local government employees in Onitsha south-eastern Nigeria. Epidemiol Rep 3:
- Talukder A, Hossain MZ (2020) Prevalence of Diabetes Mellitus and Its Associated Factors in Bangladesh: Application of Two-level Logistic Regression Model. Sci Rep 10:
- Adaramaja SR, Abdullahi AA, Adekeye DS (2010) Sedentary life style and wellness in Kaduna State Nigeria. Ethno Med 4: 15-19.
- Adeleke OR, Ayenigbara GO (2019) Preventing Diabetes Mellitus in Nigeria Effect of Physical Exercise Appropriate Diet and Lifestyle Modification. Int J Diabetes Metab 25: 113-117.
- Hamilton MT, Hamilton DG, Zderic TW (2014). Sedentary behavior as a mediator of type 2 diabetes. Med Sport Sci 60: 11-26.
- Colberg SR, Sigal RJ, Yardley JE, Riddell MC, Dunstan DW, et al. (2016) Physical Activity/Exercise and Diabetes A Position Statement of the American Diabetes Association. Diabetes Care 39: 2065-2079.
- Ard D, Tettey NS, Feresu S (2020) The Influence of Family History of Type 2 Diabetes Mellitus on Positive Health Behavior Changes among African Americans. Int J Chronic Dis 202: 8016542.
- Asiimwe D, Mauti GO, Kiconco R (2020) Prevalence and Risk Factors Associated with Type 2 Diabetes in Elderly Patients Aged 45-80 Years at Kanungu District. J Diabetes Res 2020: 5152146.
- Mainous AG, Diaz VA, Everett CJ (2007) Assessing Risk for Development of Diabetes in Young Adults. Ann Fam Med 5: 425-429.
- Noble D, Mathur R, Dent T, Meads C, Greenhalgh T (2011) Risk models and scores for type 2 diabetes: systematic review. BMJ 343: d7163.
- Fort SMA, Lunar BC, Lahoz C, Mostaza JM, Herranz AJC, et al. (2016) Performance of the Finnish Diabetes Risk Score and a Simplified Finnish Diabetes Risk Score in a Community Based Cross Sectional Programme for Screening of Undiagnosed Type 2 Diabetes Mellitus and Dysglycaemia in Madrid Spain: The SPREDIA 2 Study. Plos One 11: e0158489.
- Abdallah M, Sharbaji S, Sharbaji M, Daher Z, Faour T, et al. (2020) Diagnostic accuracy of the Finnish Diabetes Risk Score for the prediction of undiagnosed type 2 diabetes prediabetes and metabolic syndrome in the Lebanese University. Diabetol Metab Syndr 12: 84.
- Zhang L, Zhang Z, Zhang Y, Hu G, Chen L (2014) Evaluation of Finnish diabetes risk score in screening undiagnosed diabetes and prediabetes among US adults by gender and race NHANES 1999-2010. Plos One 9: e97865.
-
 Table 1
 -
Table 2
-
Table 3
-
Table 4
-
Table 5


QUICK LINKS
- SUBMIT MANUSCRIPT
- RECOMMEND THE JOURNAL
-
SUBSCRIBE FOR ALERTS
RELATED JOURNALS
- Journal of Ageing and Restorative Medicine (ISSN:2637-7403)
- Journal of Pathology and Toxicology Research
- International Journal of Medical and Clinical Imaging (ISSN:2573-1084)
- Journal of Otolaryngology and Neurotology Research(ISSN:2641-6956)
- Journal of Nursing and Occupational Health (ISSN: 2640-0845)
- Journal of Allergy Research (ISSN:2642-326X)
- Journal of Blood Transfusions and Diseases (ISSN:2641-4023)


