International Journal of Diabetes (ISSN: 2644-3031)

Research Article
Oral Glucose Tolerance Test 60-Min Values in Prediabetes Detection
5301
Views & Citations4301
Likes & Shares
Purpose: The unification of approaches to the diagnosis of Prediabetes is beyond doubt. The aim of this study was to determine the possibility of PG60 usage as an indicator of PD and reveal the optimal cut-off point for separation of normal glucose metabolism (NGM) and impaired (PD+DM) glucose metabolism (IGM) by PG60 level.
Methods: 134 persons (32 men and 102 women) aged 20-79 years were examined by using anthropometry and laboratory indicators. 75 g glucose loading was performed, and glycemic levels were examined after 30, 60, 90 & 120 min. The HbA1C examined by the SDA1c Care (SD biosensor, Korea). Fasting and post load venous plasma glucose was determined by Precision PCx Medi Sense (Abbot, USA). By using linear and multiple regression methods equations were obtained, and by applying these equations we have calculated 1 h glycemic level post-load 75 g glucose. Qualitative characteristics of the diagnostic test as Sensitivity, Specificity, Positive Predictive Value, Negative Predictive Value, Overall Diagnostic Accuracy and Youden Index were used for the evaluation of cut-off point for 1-h glycemic level post-load 75 g glucose.
Results: The relationship between PG60 and HbA1C, PG60 and FG, PG60 and PG120 was studied by using correlation analyses. We also studied the relationship between PG60 and HbA1C (r=+0.66 [95%CI +0.552, +0.745]), Gl60 and FG (r=+0.41 [95%CI +0.264, +0.545]) was as well as between PG60 and PG120 (r=+0.63 [95%CI +0.516, +0.722]). All of three correlation coefficients were statistically significant, p
The equation for PG60 cut-off point was calculated by applying multiple regression analyses.
The quality characteristics of received cut-off point by equation and other possible cut-off points were obtained.
Minimal Youden Index had PG60 cut-off point “≥155 mg/dl” (20.9 %). Maximal Youden Index had FG cut-off point “≥110 mg/dl” (70.2 %). Index Youden for PG60 cut-off point “≥196 mg/dl” and “≥197 mg/dl” were higher than 50.0 %.
Conclusion: The point PG60 of OGTT may be used for PD detection. The PG60 “≥197 mg/dl” cut-off point has satisfactory quality characteristics and would be recommended for PD diagnostics.
Keywords: Prediabetes, Diabetes mellitus, Oral glucose tolerance test, Plasma glucose level after 60 min, Cut-off point
Abbreviations: AAEDTE: Azerbaijan Association of Endocrinology, Diabetology and Therapeutic Education; BMI: Body mass index; CI: Confidence interval; DBP: Diastolic blood pressure; DM: Diabetes mellitus; FG: Fasting glucose; HbA1C: Glycated hemoglobin; IGM: Impaired glucose metabolism; NGM: Normal glucose metabolism; OGTT: Oral glucose tolerance test; PD: Prediabetes; PG30: Plasma glucose level after 30 min; PG60: Plasma glucose level after 60 min; PG90: Plasma glucose level after 90 min; PG120: Plasma glucose level after 120 min; SBP: Systolic blood pressure; WC: Waist circumference; WHO: World Health Organization
INTRODUCTION
Prediabetes (PD) is the term used for individuals whose glucose levels do not meet the criteria for diabetes mellitus (DM) but are too high to be considered normal. PD should not be viewed as a clinical entity in its own right but rather as an increased risk for DM and cardiovascular disease [1].
Fasting glucose (FG), glycated hemoglobin (HbA1C) and 2-h plasma glucose value during 75-g oral glucose tolerance test (OGTT) are used for DM diagnostics. The same tests are applied also for PD detection [1].
OGTT takes longer than the other two tests to diagnose DM.
OGTT has been changed over the past decades: glucose load varied 50, 75, and 100 g; glucose measurement times also varied after 30 (PG30), 60 (PG60), 90 (PG90) and 120 (PG120) min [2]. Thereafter, in 1980, the World Health Organization (WHO) recommended a standardized OGTT score with a 75 g glucose loading and in 1985 two points were determined during the test: FG and PG120 [2-4]. The significance of post-loading glucose is emphasized by the fact of the relationship between PG120 values (≥11.1mmol/l) and cardiovascular mortality, shown in DECODE and HOORN studies. At the same time, there was no such relationship between FG (≥7.0mmol/l) and cardiovascular mortality [5,6].
Shortening of the OGTT duration to 1 h was first recommended in 1963 [2,7].Large-scale population studies [8-11] have shown that the PG60 ≥ 155 mg/dl (8.6 mmol/l) detected incident DM and associated complications earlier than FG or PG120 levels [12]. OPERA STUDY showed that PG60 ≥11.6 mmol / l was an optimal cut-off point for the diagnosis of DM [13]. PG60 was a more suitable screening tool for assessing the risk of DM and its complications than PG120 [14]. In “STOP DIABETES” retrospective study the annual incidence of DM was higher in individuals with PG60 concentration of more 155 mg / dL (8.6 mmol / l) than in those with elevated FG or PG120 [15]. By the opinion of the OPERA STUDY research group, the 75-g OGTT shortening to 1 h may improve its predictive value and clinical usability [13].In 2008, PG60 more than 155 mg / dl was demonstrated as for predictor of PD [16].
The aim of this study was to determine the possibility of PG60 using as an indicator of PD and reveal the optimal cut-off point for separation of normal glucose metabolism (NGM) and impaired (PD+DM) glucose metabolism (IGM) by PG60 level.
MATERIALS AND METHODS
Subjects and clinical examination
A selection from Azerbaijan Association of Endocrinology, Diabetology and Therapeutic Education (AAEDTE) database was created to conduct this research. The total group consisted of 134 cases (32 men and 102 women).
Inclusion criteria:
- Age from 20 to 79 years;
- Availability of registered anthropometric data: height (сm), weight (кg), waist circumference (сm);
- Office blood pressure measurement: systolic blood pressure (SBP), diastolic blood pressure (DBP) in mmHg;
Laboratory examination: HbA1c, FG, and PG30, PG60, PG90, PG120.
Exclusion criteria:
- Pregnancy and lactation;
- The presence of severe comorbid diseases affected the glucose metabolism state;
- Availability of previously known DM or PD;
- Absence of any inclusion criteria.
Body Mass Index (BMI) was calculated dividing the weight (kg) by the height in meters squared (m2) and evaluated by the classification of WHO [17].
OGTT was performed by using of 75 g glucose. Samples of FG, PG30, PG60, PG90, PG120 after glucose loading were measured in venous plasma by Precision PCx Medi Sense (Abbot, USA) and presented in mg/dl.
Glycohemoglobin (HbA1c) was studed by the SDA1c Care (SD biosensor, Korea) and measured in mmol/mol.
The average values ± Standard Deviation are presented in this article. The statistical significance of the differences between the average values was determined by the Student's T-test. Chi-square tests were applied to compare categorical variables [18]. A correlation analysis of the relationship between PG60 and HbA1C, FG, PG120 was performed [19]. Confidence interval (CI) 95% was determined for correlation coefficient [20].
PG60 cut-off point was calculated by using of the multiple linear regression method [21].
The following indicators were used for determinate the qualitative characteristics of the diagnostic tests: Sensitivity, Specificity, Positive Predictive Value, Negative Predictive Value, Overall Diagnostic Accuracy and Youden Index [22,23].
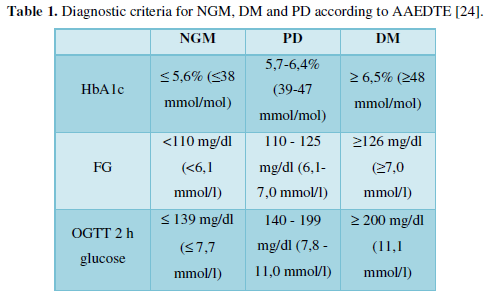
Diagnosis of PD and DM was carried out in accordance with the proposed for discussion AAEDTE Standards [24], presented in Table 1.
Based on these standards, DM was detected in 6 persons, PD - in 41 cases (n of IGM=6+41=47) and NGM - in 87 persons.
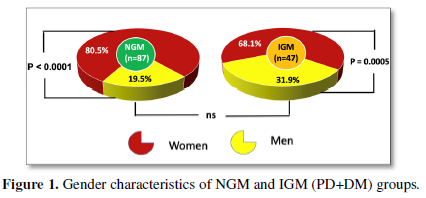
The gender characteristics of NGM and IGM (PD+DM) groups are presenting in Figure 1.
As it is seen from Figure 1 in all three groups prevalence of female was higher than prevalence of male: 80.5%/19.5% in NGM group, 68.1%/31.9% in IGM (PD+DM) group. At the same time, there were no statistically significant gender differences between the analyzed groups.
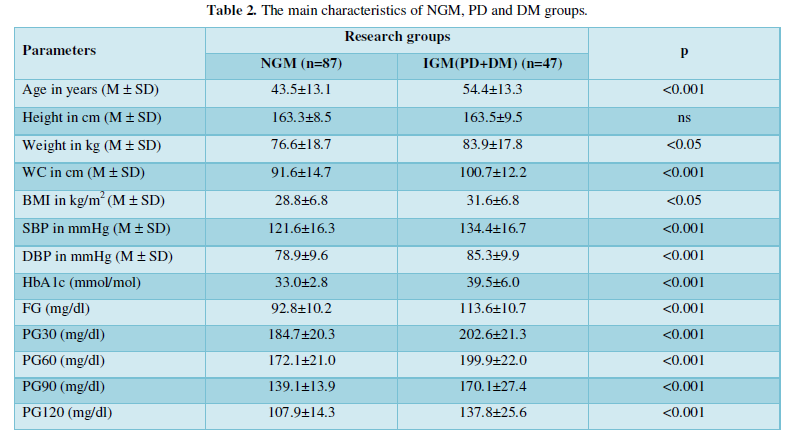
The main characteristics of three groups are presented in Table 2.
RESULTS
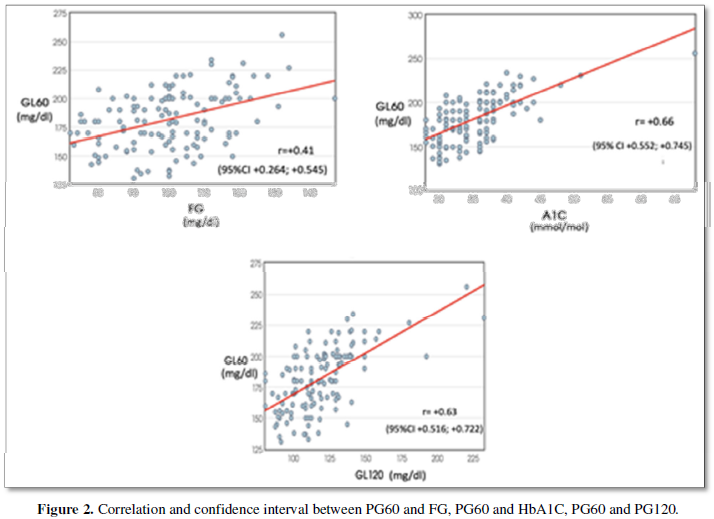
The relationship between PG60 and HbA1C, PG60 and FG, PG60 and PG120 was studied by using correlation analyses. Data on the correlation between them are shown at Figure 2.
As it is seen from Figure 2, the relationship between PG60 and HbA1C (r=+0.66 [95%CI +0.552, +0.745]), Gl60 and FG (r=+0.41 [95%CI +0.264, +0.545]) was as well as between PG60 and PG120 (r=+0.63 [95%CI +0.516, +0.722]) has shown. All of three correlation coefficients were statistically significant, p
The equation for PG60 cut-off point was calculated by applying multiple regression analyses.
PG60=58.9301+2.8808*HbA1C-0.2939*FG+0.4332*PG120
The upper limits of the norm for HbA1C (38 mmol/mol), FG (109 mg/dl) and PG120 (139 mg/dl) were used.
The received solution was 197mg/dl. So, all points of the PG60 more than 197 mg/dl must be consider appropriate for IGM (PD+DM). Other PG60 values, i.e., plasma glucose levels of 197 mg/dl or less must be evaluated as normal.
We found it necessary to investigate the quality characteristics of this one and other possible cut-off points.
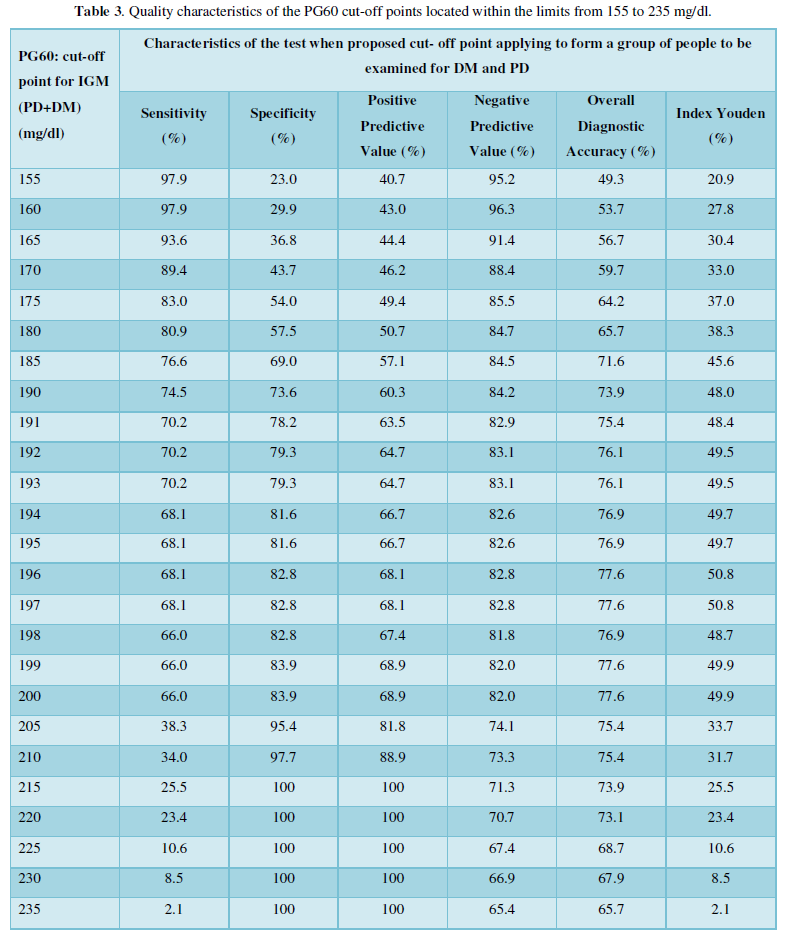
Quality characteristics of the PG60 cut-off points located within the limits from 155 to 235 mg/dl are shown in Table 3.
As it is seen from Table 3 the minimal Youden Index had PG60 cut-off point “≥155 mg/dl” (20.9 %). The Youden Index was increasing until “≥197mg/dl” cut-off point, and was decreasing after “≥198 mg/dl” cut-off point. Optimal cut-off points for PG60 by Youden index are “≥196 mg/dl” and “≥197 mg/dl”, they are close to the cut-off point “≥198 mg/dl” (which was calculated by the multiple regression equation). Therefore, cut-off points “≥196 mg/dl” or “≥197 mg/dl” are differed by higher Sensitivity (68.1%), Specificity (82.8%), Positive Predictive Value (68.1%), Negative Predictive Value (82.8%), Overall Diagnostic Accuracy (77.6%). Table 4 shows the comparative qualitative characteristics of the PG60, PG120, FG and HbA1C.
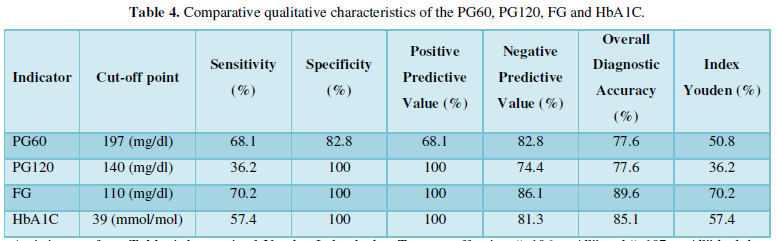
As it is seen from Table 4 the maximal Youden Index had FG cut-off point “≥110 mg/dl” (70.2 %). The Youden Index for HbA1C cut-off point “≥39 mmol/mol” was 57.4%. The Youden Index for PG60 “≥197 mg/dl” were higher than 50.0 %.
DISCUSSION
Previously, we used multiple regression equations for clarify of FG and HbA1C PD cut-off points [25].
At the present study this technique was used to determine the PG60 cut-off point for PD and “≥198 mg/dl” result was obtained. This value is significantly higher than the previously proposed value of “155 mg/dl” [8-10,15].
In order to determine which of the values is preferrable, we studied the qualitative characteristics of PG60 cut-off points from 150 mg/dl to 235 mg/dl. Sensitivity, Specificity, Positive Predictive Value, Negative Predictive Value, Overall Diagnostic Accuracy and Index Youden were used for this reason.
Cut-off point “≥155 mg/dl” (Table 3) had high Sensitivity (97.9%), very low Specificity (23.0%), moderate Positive Predictive Value (40.7%), high Negative Predictive Value (95.2%), not higher Overall Diagnostic Accuracy (49.3) and very low Youden Index (20.9%). Thus, there was a large variation in the quality indicators of “≥155 mg/dl” cut-off point. Complex indicators such us Overall Diagnostic Accuracy and Youden Index was low. It is well known that optimal result for Youden Index must be higher 50.0% [22,23]. So, cut-off point “≥155 mg/dl” would not be recommended for PD detection.
Cut-off point” ≥198 mg/dl” had Sensitivity (66.0%), Specificity (82.8%), Positive Predictive Value (67.4%), Negative Predictive Value (81.8%), Overall Diagnostic Accuracy (76.9%), Youden Index (48.7%). In this case the spread of quality indicators was not so high as in case of “≥155 mg/dl” cut-off point. Although the Youden Index was more than two times higher than in case of “≥155 mg/dl” cut-off point, its absolute value was 48.7%, i.e., was below 50.0%. Therefore, this cut-off point also cannot be conserved optimal.
Two cut-off points “≥196 mg/dl” and “≥197 mg/dl” had the same quality characteristics: Sensitivity (68.1%), Specificity (82.8%), Positive Predictive Value (68.1%), Negative Predictive Value (82.8%), Overall Diagnostic Accuracy (77.6%). The Youden Index was more than 50.0% and made up 50.8%. In our opinion the usage of PG60 “≥197 mg/dl” cut-off point is the most appropriate.
As it is seen from Table 4 the Youden Index was maximal for FG “≥110 mg/dl” (70.2%), below for HbA1C “≥39 mmol/mol” (57.4%) and minimal for PG120 “≥140 mg/dl” (36.2%). The results are somewhat unaccepted, since PG120 “≥140 mg/dl” until now was the only generally accepted indicator [1,26-28].
There was disparity in number of females and males, which would limit the result of our study, if the aim of research was to assess the frequency of occurrence of prediabetes in males and females. As our aim was to study diagnostic criteria of prediabetes diabetes gender differences are irrelevant.
CONCLUSION
PG60 point of OGTT may be used for PD detection. The PG 60 “≥197 mg/dl” cut-off point has satisfactory quality characteristics and would be recommended for PD diagnostics.
- American Diabetes Association (2021) Classification and Diagnosis of Diabetes: Standards of Medical Care in Diabetes-2021. Diabetes Care 44: 15-33.
- Jagannathan R, Neves JS, Dorcely B, Chung ST, Tamura K, et al. (2020) The Oral Glucose Tolerance Test: 100 Years Later. Diabetes Metab Syndr Obes 13: 3787-3805.
- WHO (1980) WHO Expert Committee on Diabetes Mellitus: Second report? World Health Organ Tech Rep Ser 646: 1-80.
- Succurro E, Pedace E, Andreozzi F, Papa A, Vizza P, et al. (2020) Reduction in Global Myocardial Glucose Metabolism in Subjects With 1 hour Post load Hyperglycemia and Impaired Glucose Tolerance. Diabetes Care 43: 669-676.
- DECODE study group the European Diabetes Epidemiology Group (2001) Glucose tolerance and cardiovascular mortality: Comparison of fasting and 2-h diagnostic criteria. Arch Int Med 161: 397-405.
- de Vegt F, Dekker JM, Ruhe HG, Stehouwer CD, Nijpels G, et al. (1999) Hyperglycemia is associated with all cause and cardiovascular mortality in the Hoorn population: The Hoorn Study. Diabetologia 42: 926-931.
- Succurro E, Marini MA, Arturi F, Grembiale A, Lugara M, et al. (2009) Elevated one-hour post load plasma glucose levels identify subjects with normal glucose tolerance but early carotid atherosclerosis. Atherosclerosis 207: 245-249.
- Prasanna NS, Amutha A, Pramodkumar TA, Anjana RM, Venkatesan U, et al. (2017) The 1hr post glucose value best predicts future dysglycemia among normal glucose tolerance subjects. J Diabetes Complications 31: 1592-1596.
- Oka R, Aizawa T, Miyamoto S, Yondea T, Yamagashi M (2016) One hour plasma glucose as a predictor of the development of Type 2 diabetes in Japanese adults. Diabet Med 33: 1399-1405.
- Bergman M, Chetrit A, Roth J, Jagannathan R, Sevick M, et al. (2016) One hour post load plasma glucose level during the OGTT predicts dysglycemia. Observations from the 24-year follow-up of Israel Study of Glucose Intolerance Obesity and Hypertension. Diabetes Res Clin Pract 120: 221-228.
- Pareek M, Deepak L, Bhatt DL, Nielsen ML, Jagannathan R, et al. (2017) Enhanced predictive capability of a 1hour oral glucose tolerance test: A Prospective Population-Based Cohort Study. Diabetes Care 41: 171-177.
- Bergman M, Jagannathan R, Buysschaert M, Pareek M, Olsen MH, et al. (2018) Lessons learned from the 1hour post load glucose level during the OGTT Current screening recommendations for dysglycemia should be revised. Diabet Metabol Res Rev 34: 2992.
- Saunajoki A, Auvinen J, Bloigu A, Ukkola O, Kiukaanniemi SK, et al. (2021) One-hour post load glucose improves the prediction of cardiovascular events in the OPERA study. Ann Med 53: 478-484.
- Pareek M, Bhatt DL, Nielsen ML, Jagannathan R, Eriksson K, et al. (2017) Enhanced predictive capability of a 1-hour oral glucose tolerance test a prospective population-based cohort study. Diabetes Care. 41: 171-177.
- Armato JP, DeFronzo RA, AbdulGhani M, Ruby RJ (2018) Successful treatment of prediabetes in clinical practice using physiological assessment (STOP DIABETES). Lancet Diabet Endocrinol 6: 781-789.
- Bergman M, Manco M, Sesti G, Dankner R, Pareek M, et al. (2018) Petition to replace current OGTT criteria for diagnosing prediabetes with the 1hour post load plasma glucose ≥ 155 mg/dl. Diabet Res Clin Pract 146: 18-33.
- Purnell JQ (2018) Definitions Classification and Epidemiology of Obesity. Endotext South Dartmouth MDText.com, Inc.
- Comparison of proportions calculator. Available online at: https://www.medcalc.org/calc/comparison_of_proportions.php
- Simple linear regression calculator. Available online at: https://stats.blue/Stats_Suite/correlation_regression_calculator.html
- The confidence interval of rho. Available online at: http://vassarstats.net/rho.html
- Multiple linear regression calculator. Available online at: https://stats.blue/Stats_Suite/multiple_linear_regression_calculator.html
- Chatzimichail T, Hatjimihail AT (2020) A Software Tool for Exploring the Relation Between Diagnostic Accuracy and Measurement Uncertainty Diagnostics. Diagnostics 10: 610.
- Ruopp MD, Perkins NJ, Whitcomb BW, Schisterman EF (2008) Youden Index and optimal cut point estimated from observations affected by a lower limit of detection. Biom J 50: 419-30.
- Mirzazade V, Sultanova S, Ahmedova Z, Mustafayeva S, Huseynova A, et al. (2021) Standards of diagnosis diabetes mellitus and prediabetes. Invitation to discussion. Azerbaijan Assoc Endocrinol Diabetol Ther Educ.
- Ismayilova S, Sultanova S, Huseynova A, Mirzazade V (2021) Definition of Normal Prediabetes Cutoff Point for Fasting Glycaemia on the Basis of Glucose Tolerance Test and HbA1c Interrelationships. J Endocr Soc 5: 320.
- International Diabetes Federation (2017) Recommendations for Managing Type 2 Diabetes in Primary Care Belgium.
- co.uk. (2019) Prediabetes Diagnosis Impaired Glucose Tolerance.
- Diabetes Canada Clinical Practice Guidelines Expert Committee, Punthakee Z, Goldenberg R, Katz P (2018) Definition Classification and Diagnosis of Diabetes Prediabetes and Metabolic Syndrome. Can J Diabetes 42: 10-15.
-
 Table 1
 -
Table 2


QUICK LINKS
- SUBMIT MANUSCRIPT
- RECOMMEND THE JOURNAL
-
SUBSCRIBE FOR ALERTS
RELATED JOURNALS
- Journal of Nursing and Occupational Health (ISSN: 2640-0845)
- Journal of Blood Transfusions and Diseases (ISSN:2641-4023)
- Chemotherapy Research Journal (ISSN:2642-0236)
- Journal of Carcinogenesis and Mutagenesis Research (ISSN: 2643-0541)
- Journal of Infectious Diseases and Research (ISSN: 2688-6537)
- Journal of Psychiatry and Psychology Research (ISSN:2640-6136)
- Journal of Pathology and Toxicology Research


