44878
Views & Citations43878
Likes & Shares
The manufacture of bi-layer tablets, produced by sequential compaction of loose powder layers has become of increased interest within the pharmaceutical industry due to the tailored release profiles of active ingredients that may be obtained. Bilayer tablet is suitable for sequential release of two drugs in combination, separate two incompatible substances and also for sustained release tablet in which one layer is immediate release as loading dose and second layer is maintenance dose. In case of bilayer tablets drug release can be rendered almost uni directional if drug can be incorporated in the upper non-adhesive layer its delivery occurs into the whole oral cavity.
The immediate release layer of bilayer tablet has worked as the loading dose and the sustained release layer has maintained therapeutic plasma drug concentration for prolonged time. This article explains why development and production of quality bi-layer tablets need to be carried out on purpose-built tablet presses to overcome common bilayer problems, such as layer-separation, insufficient hardness, inaccurate individual layer weight control, cross-contamination between the layers, reduced yield, etc.
Using a modified tablet press may therefore not be the best approach in producing a quality bilayer tablet under GMP-conditions, especially when high production output is required.
IDEAL CHARACTERISTICS OF BILAYER TABLET [4-5]
- A bilayer tablet should have elegant product identity while free of defects like chips, cracks, discoloration and contamination.
- It should have sufficient strength to withstand mechanical shock during its production packaging, shipping and dispensing.
- It should have the chemical and physical stability to maintain its physical attributes over The bi-layer tablet must be able to release the medicinal agents in a predictable and reproducible manner.
- It must have a chemical stability shelf-life, so as not to follow alteration of the medicinal agents.
ADVANTAGES OF THE BILAYER TABLET
- It is the dosage form and offers the greatest capabilities of all oral dosage form for the greatest dose precision and the least content variability.
- Cost is lower compared to all other oral dosage form.
- Lighter and compact.
- Easiest and cheapest to pack and strip.
- Easy to swallow with least tendency for hang-up.
- Objectionable odor and bitter taste can be masked by coating technique.
- Suitable for large scale production.
- Greatest chemical and microbial stability over all oral dosage form.
- Product identification is easy and rapid requiring no additional steps when employing an embossed and/or monogrammed punch face.
NEED OF BILAYER TABLETS
- For the administration of fixed dose combinations of different APIs, prolong the drug product life cycle, buccal/ mucoadhesive delivery systems; fabricate novel drug delivery systems such as chewing device and floating tablets for gastro-retentive drug delivery [11-13].
- Controlling the delivery rate of either single or two different active pharmaceutical ingredients.
- To modify the total surface area available for API layers either by sandwiching with one or two inactive layers in order to achieve swellable/erodible barriers for modified release.
- To separate incompatible Active pharmaceutical ingredient (APIs) from each other, to control the release of API from one layer by utilizing the functional property of the other layer (such as, osmotic property).
MATERIALS AND METHODS
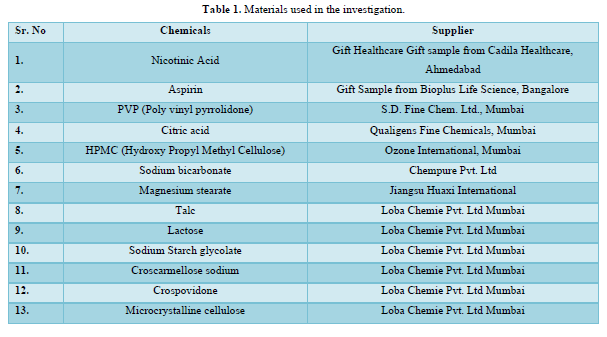
Materials (Table 1)
Pre-formulation characteristics
The following properties of active pharmaceutical ingredients (API)were investigated;
- Organoleptic properties
- Solubility analysis
- Loss on drying
- Melting point
Organoleptic properties
Organoleptic properties of the drug substance are very important for designing the dosage from. The color, odor and tests of the drug are characterized.
Solubility analysis
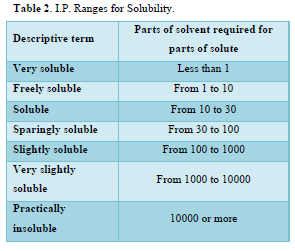
An important physical-chemical property of a drug substance is solubility, especially aqueous solubility [34]. A drug must possess some aqueous solubility for therapeutic efficacy in the physiological pH range of 1 to 8. For the determination of solubility of Nicotinic acid and Aspirin in various solvents that were methanol, ethanol, chloroform and distilled water etc. 5mg of each drug was added to 10 ml of each solvent in a test tube and shaken for few minutes at room temperature (21.0± 1.5°C) (Table 2).
Loss on drying (%)
Loss on drying is the loss of weight expressed as percentage w/w resulting from water and volatile matter of any kind that can be driven off under specified conditions [35].
Loss on drying is directly measured by IR moisture balance. Firstly, calibrated the instrument by knob, then taken 5 gram of sample (powder) and fixed the temperature at 100°C to 105°C for 15 min and constant reading, and fixed the knob and check percent moisture.
Loss on drying (%) = (Initial weight of sample-Weight of sample after drying*100) / (Initial weight of sample)
Melting point
Melting point of Nicotinic acid and Aspirin was determined using open capillary method by melting point apparatus [36]. Fine powder of the drug was filled in glass capillary tube which was sealed at one end. The capillary tube was tied to the thermometer and thermometer was kept in Theil’s tube apparatus and then slowly increased the temperature of the apparatus and recorded the temperature at which drug was completely melted. The observed melting point of the drug was compared with melting point given in literature.
Determination of UV-Visible absorption maxima of Nicotinic acid and Aspirin
Preparation of calibration curve of Nicotinic acid in 0.1 N HCl:10mg of Nicotinic acid was engaged in 10ml volumetric flask and dissolved up to 10ml with 0.1 N Hydrochloric acid to contribute the concentration of 1000g/ml.1ml of beyond was diluted to 10mlwith 0.1 N HCl to give concentration of 100g/ml. From the beyond stock solution, aliquots of 0.5, 1.0, 1.5, 2.0 and 2.5 ml were shifted to 10 ml volumetric flasks and made up to the mark with 0.1 N HCl. This solution was perused in UV-Visible Spectrophotometer. Sample was subjected to scan with a wavelength range of 200.0 to 400.0 with fast scan speed. The absorbance of these and a graph of concentration versus absorbance was plotted.
Preparation of calibration curve of Aspirin in 0.1 N HCl: Accurately weighed 10 mg of drug were dissolved in 10 ml of 0.1 N HCl solutions in 10 ml of volumetric flask. The resulted solution 1000µg/ml and from this solution 0.1 ml pipette out and transfer into 10 ml volumetric flask and volume make up with 0.1 N HCl solution prepare suitable dilution to make it to a concentration of 10μg/ml for Aspirin. The spectrum of this solution was run in 200-400nm range in U.V spectrophotometer (Labindia-3000+).
FTIR spectroscopy of Nicotinic acid and Aspirin
The purity of pure drug was determined by I.R. Approximately 10 mg of Nicotinic acid and Aspirin was triturated with 100 mg of dried potassium bromide (KBr) in agate mortar. Pellet was prepared by using KBr press pellet method. Pellet was scanned between the ranges of400 to 2000 cm-1 with background correction [37]. The spectrum was recorded and major peaks were determined.
Formulation development of bilayer tablet by direct compression
The term “direct compression” is defined as the process by which tablets are compressed directly from powder mixture of API and suitable excipients. No pretreatment of the powder blend by wet or dry granulation procedure is required.
Preparation of instant layer of Aspirin (Phase-1)
Fast dissolving (Instant Layer) tablets of Aspirin were prepared by direct compression method after incorporating different super disintegrants such as, croscarmellose sodium (Ac-Di-Sol), crospovidone and sodium starch glycolate in different concentrations. The ingredients given below were weighed and mixed in geometric progression in a dry and clean mortar. Then the ingredients were passed through mesh#60.
Magnesium stearate as lubricant and talc as glidant were added in a final step and mixed, this blend was subjected to analysis of pre-compression parameters which included Angle of repose, Bulk density, Tap density, Carr’s index and Hausner’s ratio.
The Blend was compressed on 8mm (diameter)fat punches on a ‘Rimek mini press 16station rotary compression machine. Nine different formulations of Aspirin were prepared and each formulation contained one of the three disintegrant in different concentration [38]. Each tablet weighing 350mg, were obtained.
RESULTS AND DISCUSSION
Pre-formulation study
Organoleptic properties (Table 3)

Solubility analysis (Table 4)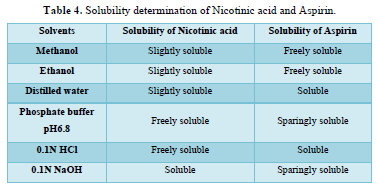
Solubility of Nicotinic acid was examined that was soluble in 0.1N NaOH, slightly soluble in methanol, ethanol, distilled water, and freely soluble in phosphate buffer pH 6.8 and 0.1N HCl. The solubility of Aspirin was examined freely soluble in methanol and ethanol, sparingly soluble in phosphate buffer pH 6.8 and 0.1N NaOH, soluble in 0.1N HCl and distilled water.
Results: Results of loss on drying of Nicotinic acid and Aspirin were found to be 0.274±0.005% and 0.352±0.002%.
Melting point
Results: Results of melting point of Nicotinic acid and Aspirin were found to be 234-237°C and134-136°C respectively.
Calibration curve of Nicotinic acid and Aspirin (Table 5, Figure 1 & Table 6, Figure 2)
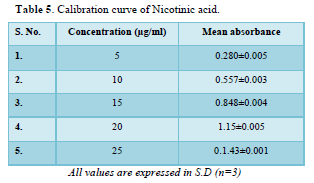
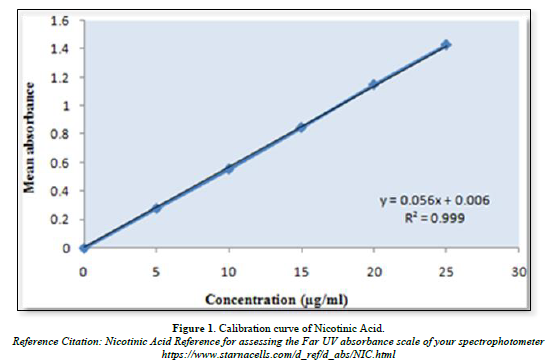
The linear regression analysis was done on Absorbance data points. The results are as follow for standard curve
Slope = 0.056
The intercept = 0.006
The correlation coefficient (r2) = 0.999
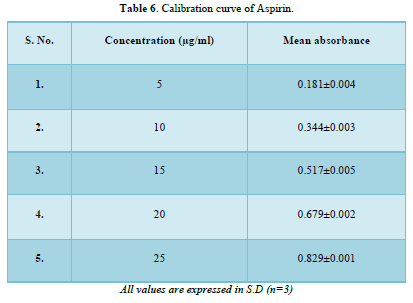
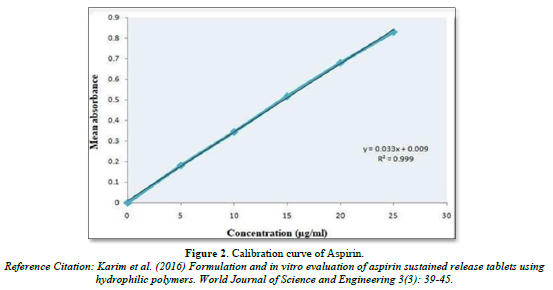
The linear regression analysis was done on Absorbance data points. The results are as follow for standard curve
Slope = 0.033
The intercept = 0.009
The correlation coefficient (r2) = 0.999
FTIR spectra of Nicotinic acid and Aspirin
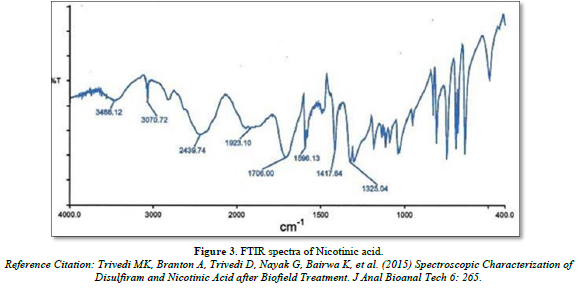
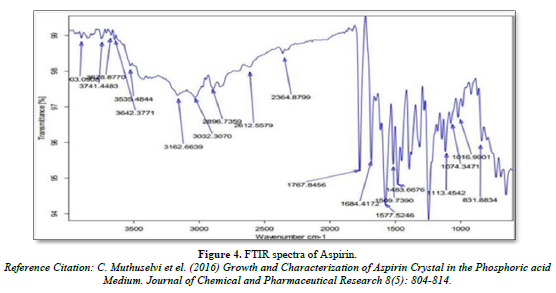
Infra- red spectrum is an important record which gives sufficient information about the structure of a compound. This technique provides a spectrum containing a large number of absorption band from which a wealth of information can be derived about the structure of an organic compound. The region from 0.8 µ to 2.5 µ is called Near Infra-red and that from 15µ to 200 µ is called Far infra-red region. Approx. 5 mg of drug was mixed with KBr and prepared the IR pallet. Pallet was analyze using FT-IR spectrophotometer (Bruker, USA) (Figures 3 & 4).
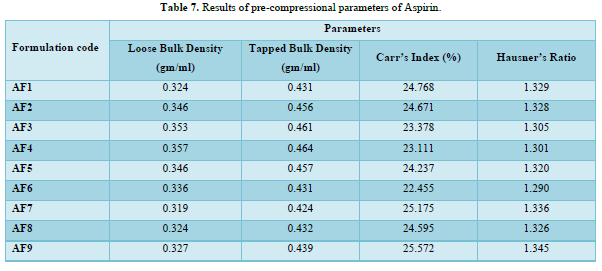
Results of pre-compressional parameters of instant release layer of Aspirin
The loose bulk density (LBD) and tapped bulk density (TBD) of the powders of different formulations were evaluated before the compression of powders in to tablets. The bulk density and the tapped density for all the formulations varied from 0.319 to 0.357gm/cm3 and 0.424 to 0.464gm/cm3 respectively.
The values obtained lies within the acceptable range. The difference exists between the bulk density and tapped density found to be very few. This result helps in calculating the % compressibility of the powder.
The result of Hausner’s ratio of all formulations ranges from 1.290to 1.345. Results of Hausner’s ratio of all formulations were shown in Table 7 which indicates that the flow ability of all the formulation.
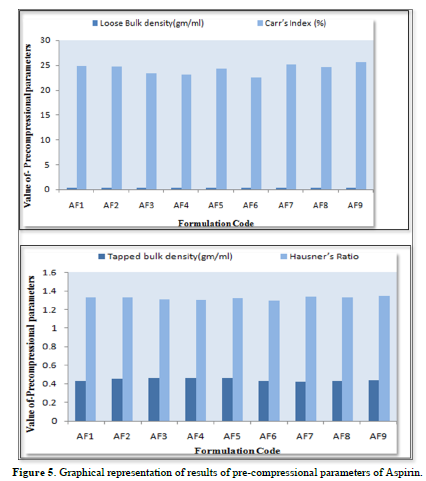
The results of the Compressibility index of all the formulations ranges from 22.455% to25.175%. Results of Compressibility index of all the formulations were shown in the Table 7. Results clearly showed that the flow ability of all the formulations was good and also the powder had good compressibility (Figure 5).
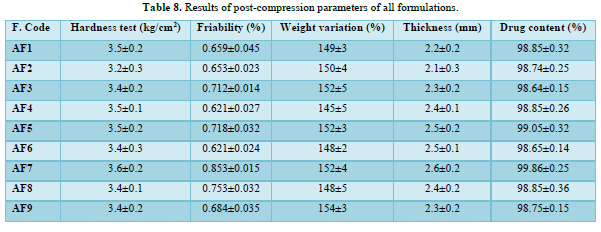
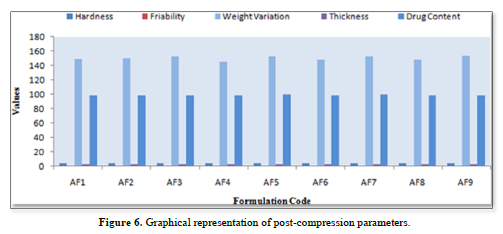
Results of post-compression parameters of all formulations (Table 8 & Figure 6)
Thickness
The thickness of the tablets was reported in the micrometer(mm). The thickness of tablet indicates that, die fill was uniform. The thickness depends on the size of the punches (8mm) and the weight of one tablet (150mg). The average weight of each formulation was recorded in shown in Table 8. The value of thickness ranges between 2.1±0.3 to2.6±0.2mm.
Friability
Friability determines the strength of the tablets. The values of friability test were given in the Table 8. The friability for all the formulations was below 1% indicating that the friability was within the prescribed limits. The results of friability test indicate that the tablet possesses good mechanical strength. The friability value ranges from 0.621±0.024 to 0.853±0.015.
Hardness
The mean hardness values were measured for all the formulation using Monsanto hardness tester. The results were tabulated in Table 8. The hardness value ranges from 3.2±0.3 to 3.6±0.2kg/cm2.
Uniformity of weight
Twenty tablets were randomly selected from each formulation and evaluated. The average weight of each formulation was recorded and is shown in Table 8. The obtained data were almost uniform. The values of tablets average weight ranging from 145±5 to 154±3mg. All the tablets passed weight variation test as the % weight variation was within the USP Pharmacopoeia’s limits of ±5% of the weight.
Drug content
The % drug content of all the formulated tablets were found within the limit. % Drug content value of drug was within 98.64±0.15% to 99.86±0.25%. The results within the range indicate uniform of mixing. The Table 8 shows the % drug content in each formulation.
Results of disintegration time of instant layer of Aspirin
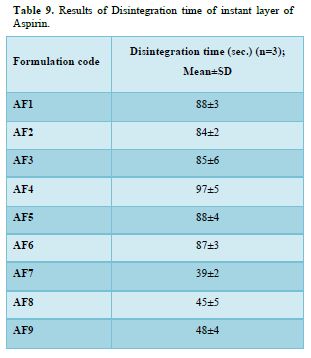
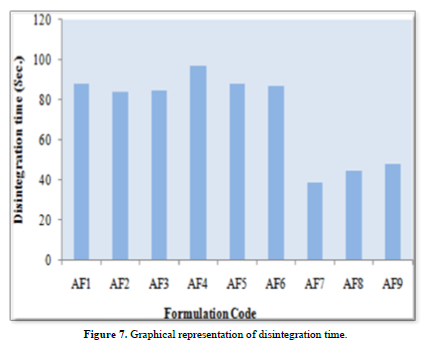
Disintegration time of formulation AF1, AF2, AF3, AF4, AF5, AF6, AF7, AF8 and AF9 was found to be 88±3, 84±2, 85±6, 97±5, 88±4, 87±3, 39±2, 45±5 and 48±4 sec respectively. The Minimum Disintegration time was found in formulation IF7(39±2), select as optimized formulation for instant layer of aspirin (Table 9 & Figure 7).
Formulation of Nicotinic acid matrix tablets
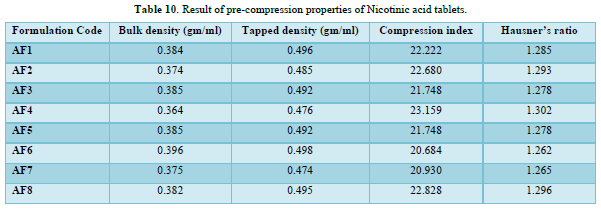
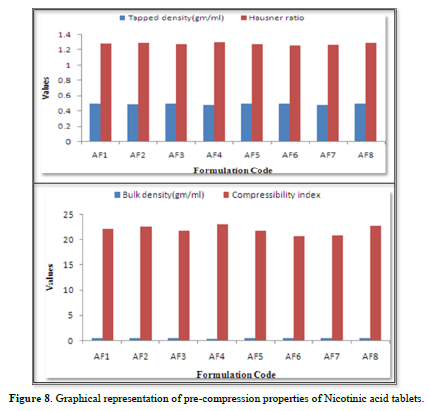
The loose bulk density (LBD) and tapped bulk density (TBD) of the powders of different formulations were evaluated before the compression of powders in to tablets. The bulk density and the tapped density for all the formulations varied from 0.364 to 0.396 gm/cm3 and 0.474 to 0.498gm/cm3 respectively.
The values obtained lies within the acceptable range. The difference exists between the bulk density and tapped density found to be very few. This result helps in calculating the % compressibility of the powder.
The result of Hausner’s ratio of all formulations ranges from 1.262 to 1.302. Results of Hausner’s ratio of all formulations were shown in Table no 3.8 which indicates that the flow ability of all the formulation.
The results of the Compressibility index of all the formulations ranges from 20.684% to 23.159%. Results of Compressibility index of all the formulations were shown in the Table 10. Results clearly showed that the flow ability of all the formulations was good and also the powder had good compressibility (Figure 8).
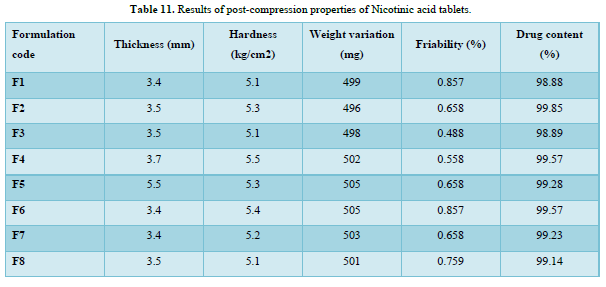
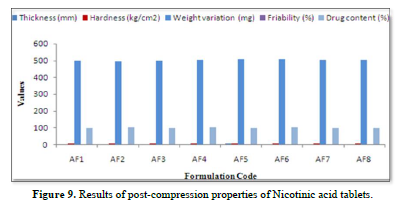
Results of post-compression properties of sustain release tablets of Nicotinic acid (Table 11 & Figure 9)
Thickness
The thickness of the tablets was reported in the micrometer (mm). The thickness of tablet indicates that, die fill was uniform. The thickness depends on the size of the punches (8 mm) and the weight of one tablet (150mg). The average weight of each formulation was recorded in shown in Table 11. The value of thickness ranges between 3.4 to 5.5mm.
Friability
Friability determines the strength of the tablets. The values of friability test were given in the Table 11. The friability for all the formulations was below 1% indicating that the friability was within the prescribed limits. The results of friability test indicate that the tablet possesses good mechanical strength. The friability value ranges from 0.488 to 0.857.
Hardness
The mean hardness values were measured for all the formulation using Monsanto hardness tester. The results were tabulated in Table 11. The hardness value ranges from 5.1 to 5.5kg/cm2.
Uniformity of weight
Twenty tablets were randomly selected from each formulation and evaluated. The average weight of each formulation was recorded and is shown in Table 11. The obtained data were almost uniform. The values of tablets average weight ranging from 496 to 505 mg. All he tablets passed weight variation test as the % weight variation was within the USP Pharmacopoeia’s limits of ±5% of the weight.
Drug content
The % drug content of all the formulated tablets were found within the limit. % Drug content value of drug was within 98.88 % to 99.85 %. The results within the range indicate uniform of mixing. The Table 11 shows the % drug content in each formulation.
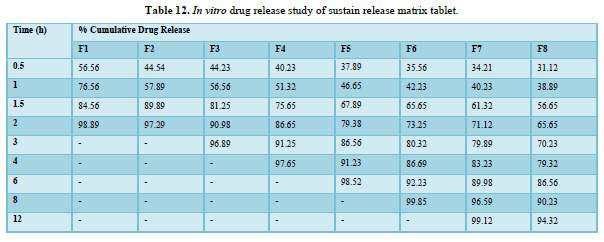
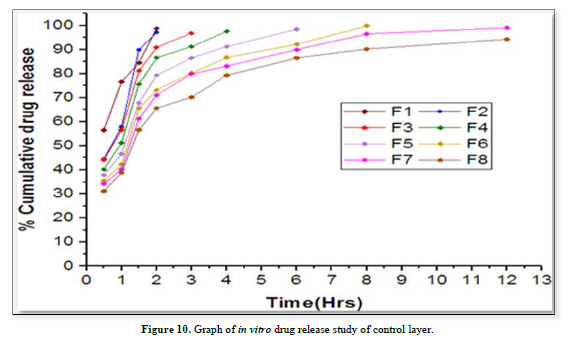
In vitro drug release study of sustain release matrix tablet (Table 12 & Figure 10)
Results of formulation development of bilayer tablet (Tables 13-15 & Figure 11)
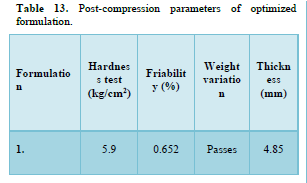
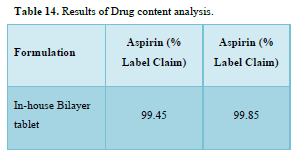
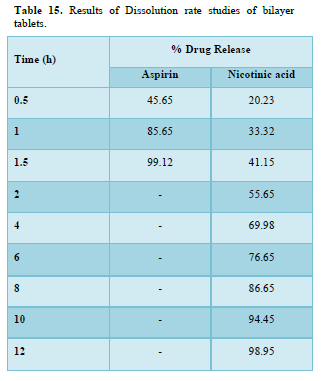
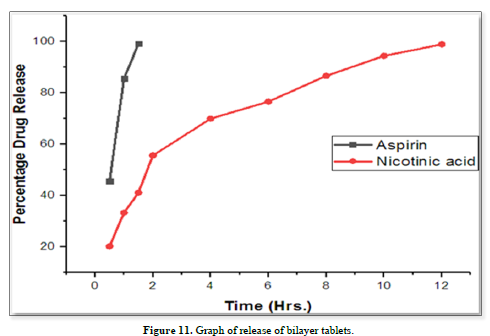
A dissolution study shows the release of Aspirin and Nicotinic acid. The Instant layer of Aspirin release approx. 99.12 percent drug within 1.5 h and control layer Nicotinic acid shows release up to 12 h approx. 98.95 percent of drug release in 12 h.
SUMMARY
Fast dissolving (Instant Layer) tablets of Aspirin were prepared by direct compression method after incorporating different super disintegrants such as, croscarmellose sodium (Ac-Di-Sol), crospovidone and sodium starch glycolate in different concentrations. The prepared tablets were evaluated for pre-compression and post-compression parameters.
The loose bulk density (LBD) and tapped bulk density (TBD) of the powders of different formulations were evaluated before the compression of powders in to tablets. The bulk density and the tapped density for all the formulations varied from 0.319 to 0.357gm/cm3 and 0.424 to 0.464gm/cm3 respectively.
The values obtained lies within the acceptable range. The difference exists between the bulk density and tapped density found to be very few. This result helps in calculating the % compressibility of the powder. The result of Hausner’s ratio of all formulations ranges from 1.290 to 1.345. The results of the Compressibility index of all the formulations ranges from 22.455% to 25.176%. Results clearly showed that the flow ability of all the formulations was good and also the powder had good compressibility.
The thickness of the tablets was reported in the micrometer(mm). The thickness of tablet indicates that, die fill was uniform. The thickness depends on the size of the punches (8mm) and the weight of one tablet (150mg). The value of thickness ranges between 2.1±0.3 to 2.6±0.2mm.
Friability determines the strength of the tablets. friability for all the formulations was below 1% indicating that the friability was within the prescribed limits. The results of friability test indicate that the tablet possesses good mechanical strength. The friability value ranges from 0.621±0.024 to 0.853±0.015.
The mean hardness values were measured for all the formulation using Monsanto hardness tester. The hardness value ranges from 3.2±0.3 to 3.6±0.2kg/cm2. Twenty tablets were randomly selected from each formulation and evaluated. The obtained data were almost uniform. The values of tablets average weight ranging from 145±5 to 154±3mg. All the tablets passed weight variation test as the % weight variation was within the USP Pharmacopoeia’s limits of ±5% of the weight.
The % drug content of all the formulated tablets were found within the limit. % Drug content value of drug was within 98.64±0.15% to 99.86±0.25%. The results within the range indicate uniform of mixing.
Disintegration time of formulation AF1, AF2, AF3, AF4, AF5, AF6, AF7, AF8 and AF9 was found to be 88±3, 84±2, 85±6, 97±5, 88±4, 87±3, 39±2, 45±5 and 48±4 sec respectively. The Minimum Disintegration time was found in formulation IF7 (39±2), select as optimized formulation for instant layer of aspirin.
Direct compression was followed to manufacture the sustain release tablets of Nicotinic acid. Eight different formulations (AF1, AF2, AF3, AF4, AF5, AF6, AF7, & AF8) were prepared by direct compression. The control layer also evaluated for pre-compression and post-compression properties.
The loose bulk density (LBD) and tapped bulk density (TBD) of the powders of different formulations were evaluated before the compression of powders in to tablets. The bulk density and the tapped density for all the formulations varied from 0.364 to 0.396 gm/cm3 and 0.474 to 0.496 gm/cm3 respectively. The values obtained lies within the acceptable range. The difference exists between the bulk density and tapped density found to be very few. This result helps in calculating the % compressibility of the powder. The result of Hausner’s ratio of all formulations ranges from 1.262 to 1.302. The results of the Compressibility index of all the formulations ranges from 20.684% to 23.159%. Results clearly showed that the flow ability of all the formulations was good and also the powder had good compressibility.
The thickness of the tablets was reported in the micrometer (mm). The thickness of tablet indicates that, die fill was uniform. The thickness depends on the size of the punches (8 mm) and the weight of one tablet (300mg). The value of thickness ranges between 2.5±0.1 to 2.8±0.1 mm.
The prepared patch showed good tensile strength and there was no cracking sign in patch. There was an increase in tensile strength with an increase in Eudragit RLPO in polymers ratio. The drug content ranged between 97.78±0.45 and 99.12±0.36.
This test is essential to check the uniformity of drug content in different patches from a single batch. The drug content analysis of patch show that the process employed to prepared patch was capable of giving uniformity drug content and minimum batch variability. F3 is optimized formulation that shows the good result. The in vitro permeation study was done to see the effect of polymers through the Franz diffusion cell from patch having Eudragit RLPO, RSPO, HPMC, EC indifferent conc. to optimized formulation for in vitro study. All the formulation was studied and all data fitted on Zero Order, First Order to explain the diffusion mechanism and pattern. The % cumulative drug release was calculated over the study time range in 0-12 h. Data analysis for order of release kinetics the formulation followed zero order release kinetics. From the in vitro permeation study, it was confirmed that the release of formulation F3 was to be found higher as compared to other formulation (F1, F2, F4, F5, F6).
CONCLUSION
In the present study, an attempt was made to deliver a novel anti-hypertensive drug, Canagliflozin through Transdermal route in the form of Transdermal patches. Transdermal patches of matrix were prepared out of which matrix type of patches was found to be satisfactory. Among the different formulations of matrix type (F1 to F6); the formulation F3 containing Eudragit RLPO and HPMC was selected as best formulation. The drug permeation profile was also found to follow zero order kinetics. The patches were thin, flexible and transparent. The Present study showed that matrix Transdermal patches of Canagliflozin exhibited better in vitro performance than pure drug.
Acknowledgement
I wish to express my sincere gratitude to the Oriental College of Pharmacy, Bhopal for providing the proper facilities used to complete this work.
Conflict of Interest: None.
- Selvam R, Singh AK, Sivakumar T (2010) Transdermal drug delivery systems for antihypertensive drugs-A review. Indian J Pharm Biol Res 1: 1-8.
- Kakkar AP, Gupta A (1991) Gelatin based transdermal therapeutic system. Indian Drugs 29: 308-315.
- Chowdary KPR, Naidu RAS (1995) Transdermal drug delivery: A review of current status. Indian Drugs 32: 414422.
- Patel D, Patel N (2011) Transdermal drug delivery system review. Int J Biopharm Toxicol Res 1: 61-80.
- Yie W, Chien (2005) Novel Drug Delivery Systems, 2nd Vol: 50. Dekker: New York, USA pp: 301-380.
- Keleb E, Sharma RK (2010) Transdermal drug delivery system-design and evaluation. Int J Adv Pharm Sci 1: 201-211.
- Ankush I, Shembale (2010) Useful permeation enhancers for transdermal drug delivery: A review. Int J Pharm Res Dev 5: 1-6.
- Barry BW (1983) Dermatological formulations per cutaneous absorption. 18: 95-126.
- Hadgraft JW, Somers GF (2005) Percutaneous absorption. Int J Pharm 305: 2-12.
- Gilbert S, Banker CT, Rhodes C (2002) Modern Pharmaceutics. 2nd edn, Revised and Expanded 40: 263-298.
- Madishetti SK, Palem CR, Gannu R, Thatipamula RP, Panakanti PK, et al. (2010) Development of domperidone bilayered matrix type transdermal patches: Physicochemical, in vitro and ex vivo Daru 18: 221-229.
- Tanwar YS, Chauhan CS, Sharma A (2007) Development and evaluation of carvedilol transdermal patches. Acta Pharmaceutica 57: 151-159.
- Shivaraj A, Selvam RP, Mani TT, Sivakumar T (2010) Design and evaluation of transdermal drug delivery of ketotifen fumarate. Int J Pharm Biomed Res 1: 42-47.
- Alka V, Bhupesh V, Sunil P, Kishu T (2012) Formulation and evaluation of transdermal therapeutic system of matrix type clonidine hydrochloride. Pharm Lett 4: 1137-1142.
- Amish AD, Zankhana PS, Janki J (2012) Formulation and evaluation of transdermal ondansetron hydrochloride matrix patch: In vitro skin permeation and irritation study. Int J Pharm Res 2: 26-34.
- Teja AR, Hemant KS, Swetha S, Prasad MS (2012) Preparation and evaluation of transdermal patches of metformin hydrochloride using natural polymer for sustained release. Int J Pharm Pharm Sci 4: 297-302.
- Vidyavati S, Jithan, A (2010) Development and evaluation of zero order sustained release matrix type transdermal films of ibuprofen. J Glob Pharm Technol 2: 51-58.
- Gibaldi M, Feldman S (1967) Establishment of sink conditions in dissolution rate determinations theoretical considerations and application to non-disintegrating dosage forms. J Pharm Sci 56: 1238-1242.
- Higuchi T (1963) Mechanism of sustained release medication: Theoretical analysis of rate of release of solid drugs dispersed in solid matrices. J Pharm Sci 52: 1145-1149.
- Sonl S, Vinod K, Dixit (1992) Transdermal penetration enhancers, categorization. Indian Drugs 29: 465471.
- Bhargava T (2011) Current trends in NDDS with special reference to NSAIDs. Int J Pharm Biol Sci 2: 92-114.
- Margetts L, Sawyer R (2007) Transdermal Drug Delivery: Principles and opioid Therapy. Continuing Educ Anesth Crit Care Pain 7: 171-176.
- Sharma N, Agarwal G, Rana AC (2011) A Review transdermal Drug Delivery System a tool for Novel Drug Delivery System. Int J Drug Dev Res 3: 70.
- Aqil M, Sultana Y, Ali A (2003) Matrix type transdermal drug delivery systems of metoprolol tartrate, in vitro Acta Pharmaceutica 53: 119-125.
- Basubramanian V, Iyer, Ravindra C (1979) Vasavada, Evaluation of lanolin alcohol films and Kinetics of triamcinolone acetonide Release. J Pharm Sci 68: 119-125.
- Chowdary KPR, Naidu RAS (1991) Preparation and evaluation of cellulose acetate films as rate controlling membranes for transdermal use. Indian Drugs 29: 312-315.
- Mamatha T, Venkateswara Rao J, Mukkanti K (2010) Development of Matrix Type Transdermal Patches of Lercanidipine Hydrochloride, Physico-chemical and in vitro Daru18: 9-16.
- Sridevi S, Chary MG, Krishna DR, Prakash V, Diwan (2000) Pharmacodynamic evaluation of transdermal drug delivery system of glibenclamide in rats. Ind J Pharmacol 32: 309-312.


