Research Article
SUITABILITY OF AGILE AND LIGHT WEIGHT METHODS FOR DEVELOPMENT OF ORGANIZATIONAL PROJECT PORTFOLIO GOVERNANCE FRAMEWORKS
1065
Views & Citations65
Likes & Shares
The objective of this paper is to examine the suitability of agile and/or lean (lightweight) methods for development of organizational project portfolio governance frameworks and their processes. It also elaborates on whether agile factors cause the optimal actualization of the governance processes that improve the project portfolio management performance, and consequently positively affect the achievement of organizational values and benefits.
This paper is based on the outcomes of the survey which acquired the effects of different agile factors having impact on related governance processes, resulting in the conclusion on using a specific agile, lightweight or hybrid (tailored) method(s) for the development of the agile governance framework.
The results enlist the agile and lightweight factors with the most significant impact on the project portfolio governance processes, and consequently, what are predominant methods in structuring of these processes. The findings also expose the construct of the agile project portfolio governance framework, showing that agile, lightweight, and hybrid (bimodal) agile/lightweight methodologies are predominant in structuring of the governance frameworks and its processes.
Keywords: Agileand Lean Methodologies, Governance, Project Portfolio, Governance Framework, Improvement of Organizational Performance
INTRODUCTION
This research was designed in order to examine the viability of agile and lean/lightweight methodologies for the development of organizational project portfolio governance frameworks and governance processes.
Governance is defined as the process of developing, communicating, implementing, monitoring, and assuring the policies, procedures, organizational structures, and practices associated with a given program (PMI, 2017). Project portfolio governance framework is a discipline within the organizational governance, and its methods and techniques applied within the context of the organizational governance provide reasonable assurance that the organizational strategy can be achieved (PMI, 2017).
The execution of organizational and project portfolio activities is guided through governance frameworks, which establish rules and regulation, protocols and limits of power that organizations use to manage achieving their strategic goals. Governance is striving to ensure alignment of strategy and execution.
The agile governance framework consists of four agile governance process domains (Front-End, Planning, Monitoring, and Deliverables), which influence the agile project portfolio governance.
- Front-end processes shape a project and/or program and build its legitimacy through decision-making episodes and time (development of feasibility studies and analyses, their justification, influence and negotiation with a broad scale of stakeholders, identification of an endeavor, its adaptation and alignment with organizational factors, and finally approval);
- Planning governance processes include elements impacting time (schedule) and costs, culture (administrative, management, competence), accountability and leadership;
- Monitoring governance processes include control framework dealing with the core values of an organization which shall not only be replicated but increased by undertaking a project/program, involved risks, strategic uncertainties, and critical performance variables;
- Deliverable’s governance processes that influence the project/program outcomes include the proper delivery of products or services, adequate performance of investments, authorization of all undertaken work, and the achievement of objectives in required quality.
METHODOLOGY AND RESEARCH DESIGN
Agile is an umbrella term for a group of methodologies that follow the values and principles captured in the Manifesto for Agile Software Development (Agile Manifesto, 2018). Agile approach encompasses constantly evolving processes (e.g. retrospectives at the beginning of each iteration), and daily stakeholder’s interaction and feedback (e.g. no delays and lean development). The project-focused approach used in initial development phase was transformed into product-focused approach of rolling deployments during ongoing product lifecycle.
Application Lifecycle Management (ALM) is a broad term that usually refers to both processes and tools to “co-ordinate people, processes, and tools in an iterative cycle of integrated software development activities, including planning and change management, requirements definition and management, architecture management, software configuration management, build and deployment automation, and quality management”(Pampino,2011).It can be seen as the governance of a software application from the initial idea until the application is retired.
The agile methods which are attributed with the key ALM practices, including response on process changes, alignment with strategic objectives, usage of best practices and metrics, and incremental improvement (Extreme Programming, Adaptive Software Development, Dynamic System Development Method, SCRUM, Crystal, Feature Driven Development, Agile Modeling, and Internet-Speed Development) were considered in the conceptualization of the agile governance framework.
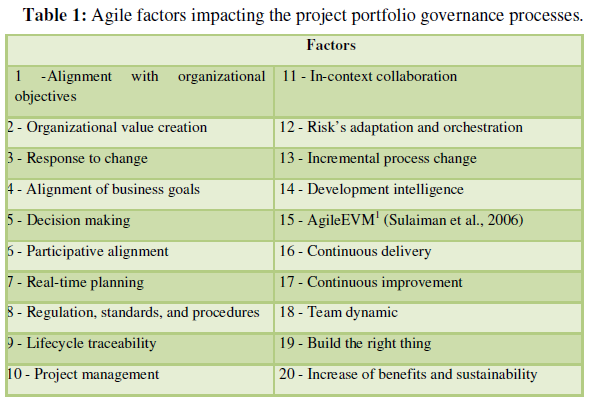
The mentioned eight most used and applied agile methods were analyzed with regard their attributes and factors conforming the governance domain processes. The examination takes into consideration the effects of different agile factors having impact on related governance domain processes, resulting in the conclusion on using a specific agile, lightweight or hybrid (tailored) methodology for the development of the agile governance framework (Table 1).
The following agile factors, derived from literature review, were considered during the analysis:

The survey research was focused on describing the essential reasons behind the agile and lean development of organizational project portfolio governance processes. As the prerequisite for conveying this survey is information standardization, it could be contended that both phenomena (agile, lean, lightweight methodologies and project portfolio governance processes) were standardized to such level that the existing theories are widely accepted by academics and professionals.
The objective of this survey was to distribute questionnaire electronically and to receive answers from diverse audience, providing more accurate picture of research phenomenon and obtaining more significant results because of the possibility of identifying a greater number of variables (Myers, 1997).
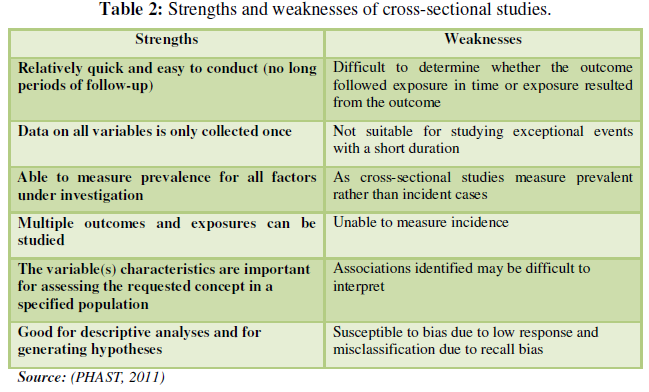
For the purpose of this observational research, the most suitable survey design is cross-sectional design or cross-sectional analysis, involving the analysis of data collected from a representative subset at one specific point in time. The strengths and weaknesses of the cross-sectional studies are shown in below Table 2 (PHAST, 2011):
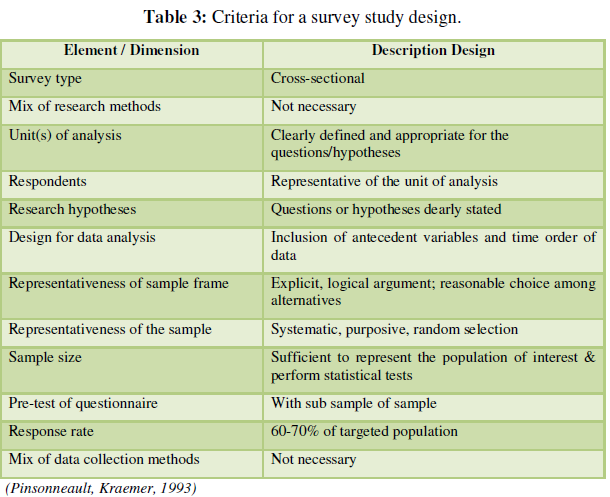
Since the results of the survey are collected at one point in time, the results can be generalized. The survey design criteria that must be met are presented in Table 3 (Pinsonneault, Kraemer, 1993):
Besides the above listed criteria elements, the attention was paid on the measurement error which could have resulted from badly structured questionnaire or request for answers.
The survey’s questionnaire, or request for answers, was designed in the three-step procedure (Saris, Gallhofer, 2014):
- Specification of the concept-by-postulation in concepts-by-intuition,
- Transformation of concepts-by-intuition in statements indicating the requested concept, and
- Transformation of statements into questions.
The quality of survey design was tested with the SQP 2.0, the Survey Quality Prediction system[1] for questions used in survey research. The SQP program is a continuously growing database of survey questions in most European languages with information about the quality of the questions and the possibility to evaluate the quality of the questions that have not been evaluated so far. To date, there is no other program in the world for that purpose (Saris, Gallhofer, 2014).
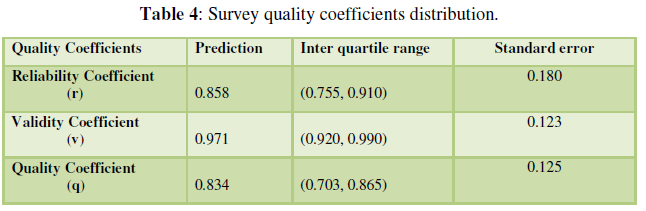
For testing the quality of questions, several survey questions were analyzed. Survey prediction overview is presented in below enclosed tables. Table 4 shows the statistical dispersion of survey quality coefficients with their prediction, inter quartile range (IQR), and standard error. The quality coefficients are the square root of the quality indicators. These are the coefficients that are estimated in the simulation. The uncertainty exists in the estimates presented in the inter quartile range and the standard error.

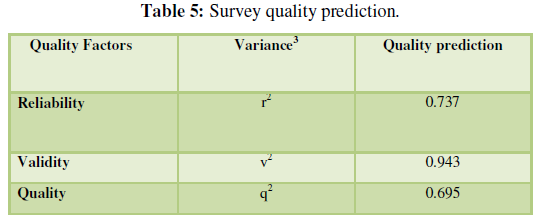
Table 5 shows survey quality factors, their variances, and the survey quality prediction.

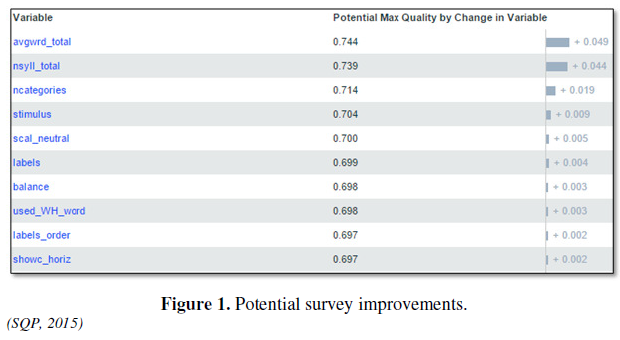
Quality prediction indices denoted sufficient confidence in the survey design. Potential improvement of the survey in order to reach the maximum quality was possible, as shown in Figure 1. The average improvement coefficient was +0,049 or 5%.
The usefulness of this approach to survey quality prediction lies in the fact that the estimates are observable before the data have been collected. The quality estimates using SQP 2.0 were obtained with minimal efforts and allowed researcher to improve data collection.
DATA COLLECTION
The qualitative data collection was harvested from the developed self-administered electronic survey conducted via Internet (electronically). For this survey Google Forms services have been used. The request for answer consisting 30 questions was distributed to the respondents, a selected pool of project/program and portfolio professionals, experts and academics, via e-mail with the survey’s hyperlink enclosed at the e-mail’s body. This selection was made in order to reduce the threat from sample bias, as the selected pool of respondents had a required knowledge of project portfolio management processes and agile/lean methodologies.
In order to ensure the reliability of the design and quality of the survey, the request for answer was staged in three phases:
- Pilot survey. The initial survey was prepared and sent to a selected number of respondents to validate the design. The pilot process provided useful comments (example feedback quoted below):
“…although I'm using agile methods in my programs intensively, I'm not used to utilize them in portfolio management, nor do I know all of these subsets to judge them…”
“Recommendation: consider re-phrasing to allow a representative panel of answers…”
“… my superiors haven’t got the word methodology or organizational in their library…”
“… my current line of work does not cover any form of governance, so the answers would not be out of practical background (only how I should/would do it) ...”
“Within my company various agile techniques are in use as this is the choice of the many countries where the company is active. I have no information which method has contributed to what goal.”
In order to clarify and fully understand the meaning of comments and suggestions, detail explanations have been asked via email and direct phone conversations. Upon discussions, the survey was restructured in order to meet research objectives.
- Final request for answer. The survey was restructured and formulated based on the following findings/issues:
- Detail knowledge of agile methodologies. The pilot survey required detail knowledge of eight agile methods, namely XP, ASD, DSDM, Scrum, Crystal, FDD, AM, ISD including their lifecycles.
- The requirement to generalize on a higher, holistic methodological level. Instead of actual methods, structure the questions with methodological representatives.
- Simplify questions and abolish detail division of agile methods.
- Survey submission. The LinkedIn service was predominately used for the respondents’ pool construct. The request for answer was sent to 226 respondents.
RESEARCH RESULTS
The results are presented based on the collected data from 81 respondents that have the following roles: executives working at a strategic level (15 or 19%), consultants (14 or 17%), project managers (12 or 15%), program managers (9 or 11%), modelers - analysts/designers/architects (6 or 7%), academics (5 or 6%), heads of IT or main IT decision makers - CIO’s (4 or 5%), operations/support (4 or 5%), quality managers (3 or 4%), developers (3 or 4%), IT managers (2 or 2%), business managers (2 or 2%), and business stakeholders (2 or 2%).
Prevalent respondents’ area of responsibility was information technology (21 or 26%), followed by program management (14 or 17%), PMO management (13 or 16%), business consultancy (11 or 14%), project management (9 or 11%), administration (5 or 6%), research and development (4 or 5%), general management (3 or 4%), and financial management (1 or 1%).
The respondents’ work experience showed predominately proficient skills scale: 20+ years (50 or 62%), followed by 10 - 20 years of experience (24 or 32%), and 5 - 10 years (7 or 9%). Business sector involvement exposed that a majority of respondents coming from technology sector (26 or 32%), followed by international (19 or 23%), public (7 or 9%), other sector(s) (5 or 6%), telecommunications (5 or 6%), services (4 or 5%), financial (4 or 5%), utilities (3 or 4%), manufacturing (3 or 4%), retail (3 or 4%), and government (2 or 2%).
In total 42 or 52% of respondents confirmed that their organizations have a project portfolio governance framework, 33 or 41% considered that the project portfolio governance framework generally helps portfolio management to succeed, and 6 or 7% of respondents stated that their organizations don't have project portfolio governance. It is significant to notice that there were zero responses on questions “The project portfolio governance is neither helpful nor harmful”, “The project portfolio governance is generally a hindrance to portfolio management processes”, and “I don't know what a project portfolio governance is”.
Agile methods adopted 41 or 51% of respondents’ organizations, 33 or 41% are in the process of adopting agile methods, and only 7 or 9% of respondents do not consider agile methods. The major agile method practiced by respondents is Scrum (56 or 69%), followed by XP (14 or 17%), ISD (13 or 16%), DSDM (12 or 15%), FDD (9 or 11%), Crystal (6 or 7%), ASD (4 or 5%), and AM (4 or 5%)[1]. 6 respondents or 7% did not practice agile methods at all.
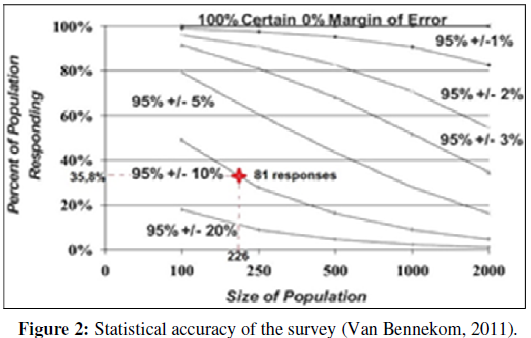
In order to determine the statistical confidence of the survey, the four factors were observed (Van Bennekom, 2011):
- Size of the population, or the group of interest for the survey, and the response rate,
- Data set (population and segmentation) analysis, in order to determine statistical confidence,
- Degree of variance in responses from the population. Initially, the variance is conservatively assumed until the data analysis is done,
- Tolerance for error, or the level of results accuracy.
The size of the population for the survey, 226 respondents, was the sample because the request for answer was sent to all 226 respondents. The response rate was 35,8% (81 respondents completed the survey). The chart in Figure 2 shows curves depicting levels of accuracy, starting from the first one at the top representing 100% certainty and 100% accuracy. This chart employs the most conservative assumption about degree of variance in responses from the population.
The variance found in each survey question and can be calculated for each survey question (as per the example for survey quality prediction). The populations mean most likely lies in the range with a 95% certainty. Each curve in the graph shows 95% certainty of a certain range of accuracy. The response rate of 35,8% positions the sample mean score of 95% of accuracy with +/-10% error range. It is to ratify that the survey results findings conform to the quality prediction values.
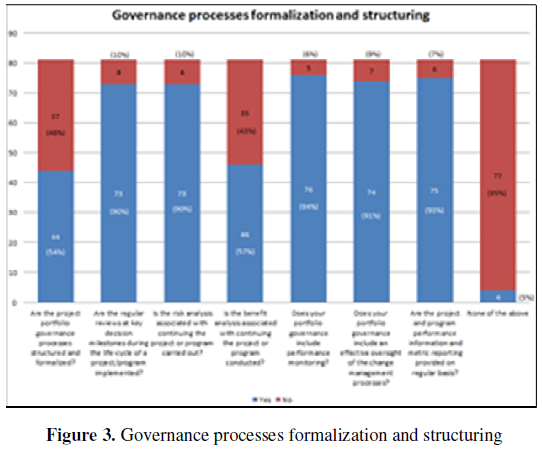
The status of formalization and structuring of project portfolio governance processes, and particularly which governance processes are supported by responders’ organizations is shown in Figure 3. Majority of responses show the inclusion of the performance monitoring processes (94%) and the regular provision of performance metrics (93%), importance of change management processes being carried out (91%), risk analysis (90%), and regular review process (90%).
Conversely, responses to the question whether the governance processes are formalized and structured exposed only 54%of consent. This indicates that organizations are still behind the required level of project portfolio governance formalization and structure.
More than half of respondents indicated the governance is important in the processes of resources optimization (63% agree + 17% strongly agree), stakeholders’ involvement in mission monitoring (60% + 30%), risk management and optimization (59% + 27%), political advocacy (59% + 12%), policies

development and statutory compliance (57% + 28%), setting and monitoring mission, strategies, direction, priorities (54% + 38%), and setup and maintenance of governance processes and planning (52% + 33%).
The examination of agile factors having impact on related governance domain processes is analyzed below.
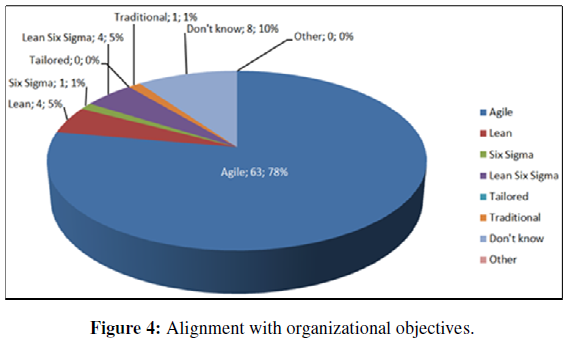
Alignment with Organizational Objectives
Majority of respondents (78%) confirmed that the alignment with organizational strategic objectives is better if the corresponding project portfolio governance front-end domain process is agile enabled, as shown in Figure 4. As this process is also part of the initiation process group, it means as well that the respondents are aware that the success (or failure) of a project or program initiative depends on the alignment of objectives’ value chain.

Organizational Value Creation
Overwhelmingly, responses (78%) indicate that the organizational value creation is influenced by agile factors, as shown in Figure 5. There are four generic determinants of value creation (Pitelis, 2010): a) organizational infrastructure and strategy, b) humanand other resources and their services, c) technologyand innovativeness, and d) unit cost economies / returns to scale.
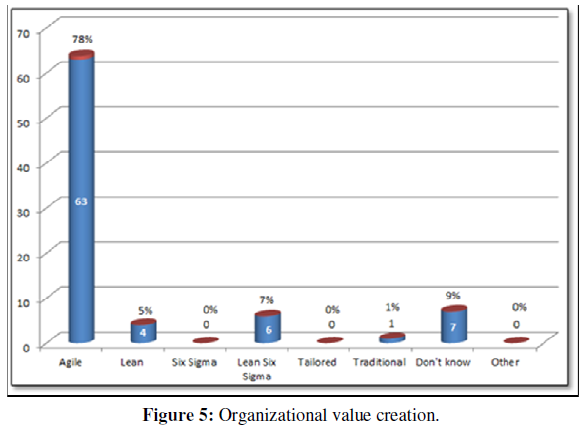
Respondents recognized that organizations following agile principles: continuous delivery of valuable products/services, harnessing changes, shortening delivery timescales, improved collaboration and communication channels, sustainable development, continuous innovation through self-organizing teams and motivated individuals, are in position of capturing and creating more values for organizations and people.
Response to Change
Change management is a comprehensive, cyclic, and structured approach for transitioning individuals, groups, and organizations from a current state to a future state with intended business benefits. It helps organizations to integrate and align people, processes, structures, culture, and strategy (PMI Managing Change in Organizations, 2013). Survey results significantly indicate, as shown in Figure 6, that governance processes based on agile methods leverage organizational capabilities in response to change (83%). Front-end adaptation governance process builds elasticity towards organizational changes impacting portfolio processes, enabling rapid process formation, gap/impact analyses, determines process waste, and estimates values stream.
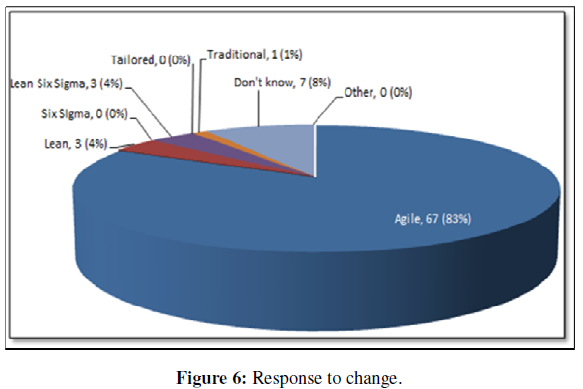
High performing organizations focus on execution and alignment by: a) maturing portfolio management practice to improve the balance between investment and risk, b) improving organizational agility to allow flexibility and quick response, embracing change as an iterative, emergent and continually evolving process, and c) tracking benefits realizations past the end of a project / program through operations to verify return of investment (PMI Pulse of Profession, 2013). The respondents acknowledged that the traditional methods and practices are not sufficient in dealing with the today’s ever-changing business environments.
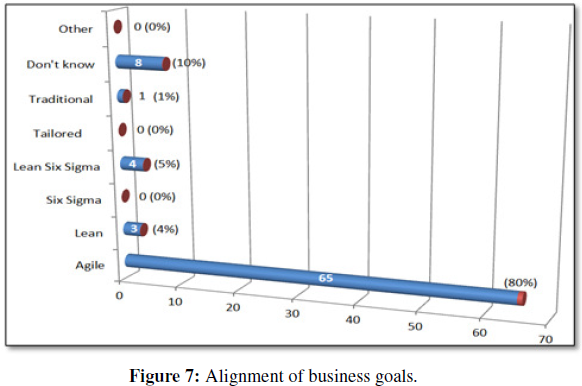
Alignment of Business Goals
Vast majority of respondents (80%), as presented in Figure 7, expressed their view that agile enabled front-end governance processes empower alignment of business goals (objectives) with organizational strategy, and that these processes are required to achieve the set performance goals. At the same time, 10% of respondents are not aware of the significance of these processes, or don’t know. Front-end alignment governance process enables alignment of portfolio processes with the organizational objectives. The strategic initiatives - projects and programs - establish the why, the what, the when, the how, and the who concerned with sustaining, changing, and improving business processes and infrastructure in support of the corporate strategy (Lyngso, 2014).

Alignment of projects and programs with the strategic planning establishes the portfolio(s) required to achieve objectives and performance goals, as well as the oversight and fiduciary responsibilities through establishing the control framework and critical performance variables. Portfolio management balances conflicting demands between programs and projects, allocates resources based on organizational priorities, and manages so as to achieve the benefits identified.
Portfolio management provides governing processes in order to forecast, make decisions that control or influence the direction of a group of portfolio components, and as they work to achieve specific outcomes, monitor their performance.
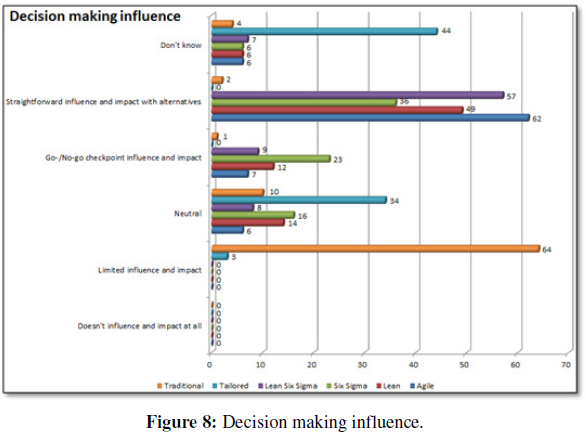
Decision Making Influence
Decision-making and approvals are governance facilitating processes that delineate the responsibility and accountability of stakeholders. Governing body makes decisions that control or influence the direction of a portfolio component or group of components (projects or programs) as they work to achieve specific outcomes.
As shown is Figure 8, survey results indicated that the lightweight methodologies (agile 64 or 76% of all responds, Lean Six Sigma 57 or 70%, Lean 49 or 60%, and Six Sigma 36 or 44%) have straightforward influence on governance decision-making process, including the impact of a decision. It is obvious that the traditional decision-making process is having limited decision-making influence and impact (64 or 79% of all responds).
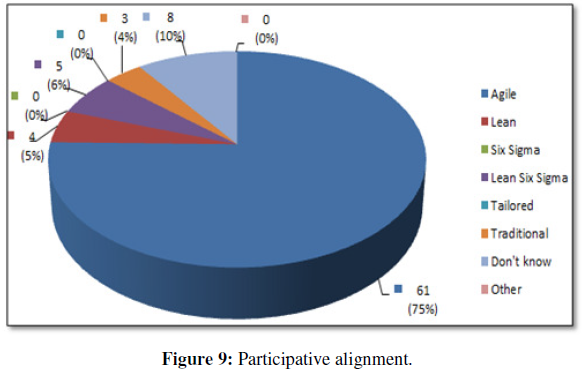
Participative Alignment
Alignment with strategic plan is the governance planning processes which involves deciding what will be done and how. It includes making strategic decisions about the direction, sets the budget-funding, identifies accountability and leadership, sets policies to guide how services will be delivered, and supervises.


Strategy planning, organization alignment and execution are concurrent and interdependent processes. Internally integrating and aligning an organization is as important and challenging as aligning the whole organization with its customers. The survey results shown in Figure 9 designate agile methods as prevalent in alignment with strategic planning and organizational operational processes. It is important to stress that 10% of respondents are not familiar with this process.
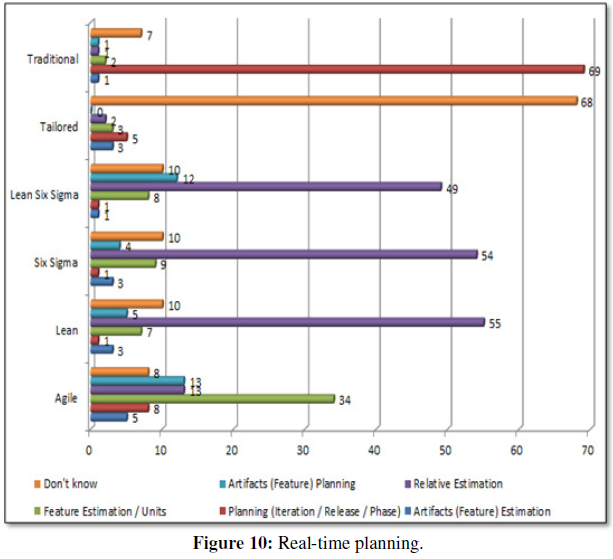
Real-time Planning
Real-time planning enables full planning integration with the project or program execution. Governance planning process is responsible for supervision of operational plans being implemented and methods of their delivery. The majority of responses, as shown in Figure 10, indicate that the traditional planning process is still predominant (69 or 85% respondents), but it is obvious that the lightweight agile planning practices are emerging: relative estimation, feature estimation/units, and artifacts planning and estimation.

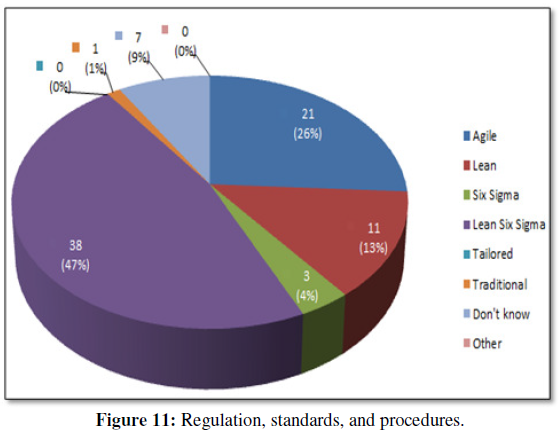
Regulation, Standards, Procedures
Lean Six Sigma was recognized as a method which builds a minimum reasonable set of organizational regulation, standards and procedures, and balances this regulatory value system the most (47% of respondents). Other lightweight methods are following (agile 26%, and Lean 13%). Traditional methods collected 1% of responses, indicating that the regulative documentation management is the area of concern. Regulation, policies, standards, functional processes and procedures, and standard operating procedures and instructions are part of the quality management system for an organization, with the aim of achieving organizational quality objectives. Quality management principles include a strong customer focus, the motivation and implication of top management, the process approach, and continuous improvement. The quality management system’s best practices are standardized and regulated by the family of ISO 9000 standards (Figure 11).

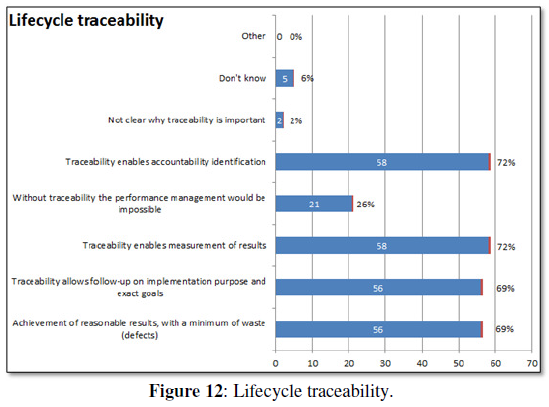
Lifecycle Traceability
Survey results indicate that the accountability identification (72%) and enabling measurement of results (72%) are predominant factors that should be supported by agile methodology in order to properly identify and align accountability for the plans that are fully integrated with project/program execution, followed by implementation purpose and exact goals (69%) and achievement of reasonable results with minimum waste (69%). Figure 12 shows the lifecycle traceability responses.

Respondents indicated the importance of lifecycle traceability, which can be seen as the governance of a service/product from the initial idea until the service/product is retired. Traceability, as a function, is responsible for managing of relationships between development artifacts that are used or produced by activities integration, and it is part of collaborative lifecycle management (IBM Rational solution, 2014), platform that integrates requirements management, change and configuration management, quality management, and design management.
Project Management in Continuous Process Improvement
Survey results indicate the importance of the role of agile project management in continuous process improvement and values delivery: for majority of respondents’ delivery of reliable results by engaging customers in frequent interaction and shared ownership (74%) and stakeholder's reporting through tangible progress in achieving manageable piece of functionality (73%) are the most important project management values.
The important values to follow are expecting uncertainty and manage for it through iterations, anticipation, and adaptation (68%), verifying estimates with team (68%), facilitating team-managed approach (68%), prioritizing artifacts relevant for the business (64%), and increasing ROI by making continuous flow of value (64%). Figure 13 shows the distribution of responses.
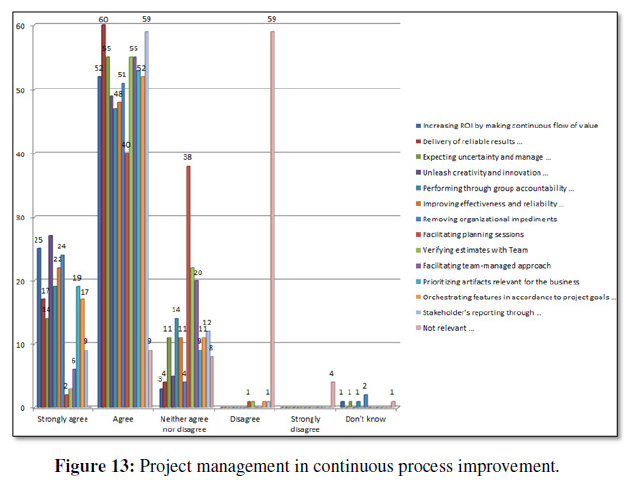
The results indicated on high importance of the three from six agile project management core values (DOI, 2014):
- Increasing return on investment by making continuous flow of value,
- Delivery of reliable results by engaging customers in frequent interaction and shared ownership, and
- Expecting uncertainty and manage for it through iterations, anticipation, and adaptation.
In-context Collaboration
Responses significantly indicate the importance of in-context collaboration, which constitutes the response to changing events and improving process predictability. The results show the following in-context value rank, as shown in Figure 14:
- Local and group stakeholders’ collaboration which leads to direct benefits from a projector program outcome earned overwhelming (84% responses),
- Common interest collaboration in achieving outcomes and values (70%),
- Immediate information accessibility to all involved stakeholders (68%),
- Stakeholders' in-context discussions in creating a single source of the veracity for decision making process (68%),
- Value-based collaboration driven by a shared vision allowing stakeholders to respond to challenges in a consistent manner (67%),
- Empowerment of stakeholders’ decision-making collaboration (67%)
- Provision of a shared repository (single source of veracity) to ensure an effective and boundless stakeholders’ collaboration (63%).
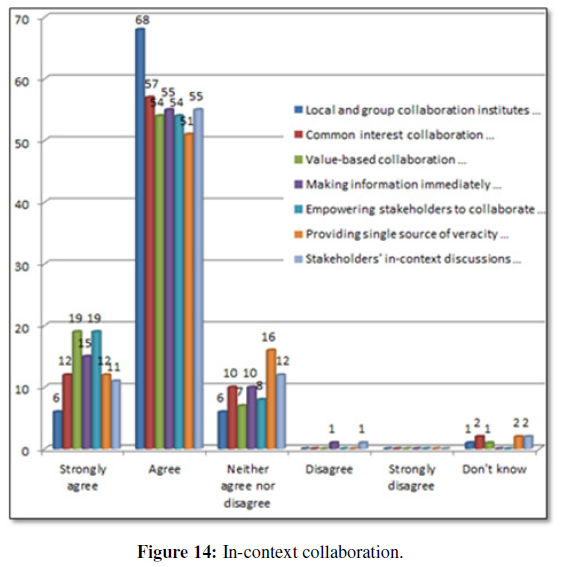
Answers placed a strong emphasis on the requisite improvement of stakeholder’s collaboration, deliberations on project or program artifacts, and decision-making sourcing and preparation.
Risks Adaptation and Orchestration
Integrating risks into planning, budgeting, reporting and forecasting as well as into the context of overall performance can lead to better decisions through risk-adjusted plans and budgets. Based on the responses, agile methods contribute the most to the governance monitoring processes in its dealing with the risks’ adaptation and orchestration. Results indicated on the significance of the following agile features, as shown in Figure 15:
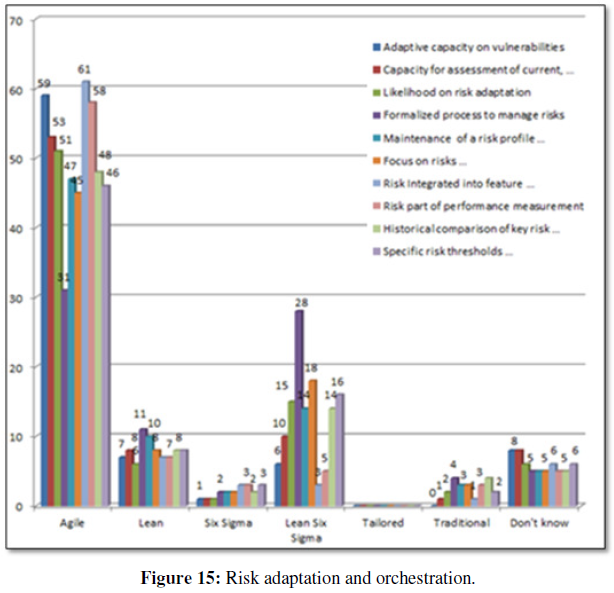
- Risk integrated into feature/release planning (75% of responses),
- Adaptive capacity on vulnerabilities (73%),
- Risk part of performance measurement (72%),
- Capacity for assessment of current, actual, future, and potential vulnerabilities (65%),
- Likelihood on risk adaptation (63%).
The lightweight Lean Six Sigma method follows agile with regard to the formalization of risk management process (35% respondents). It is significant to notice that respondents consider traditional method insufficiently effective in dealing with risk adaptation and orchestration.
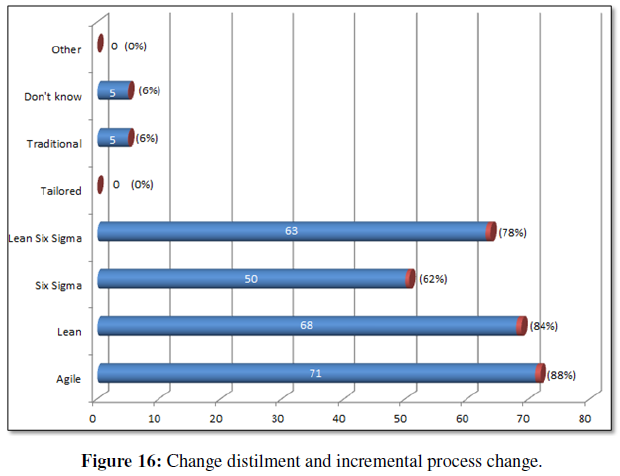
Change Distilment and Incremental Process Change
Responses indicate that the lightweight methodologies support continuous improvement efforts and incremental process changes: agile methods the most (88% of respondents), Lean (84%), Lean Six Sigma (78%), and Six Sigma (62%), as shown in Figure 16.
The survey results confirmed that change distilment, or process of obtaining the baseline volatility contained into the change, and process breakdown in order to set up an incremental improvement in collaborative manner and bridge the transitional stage of the change, is supported the most by agile methods.
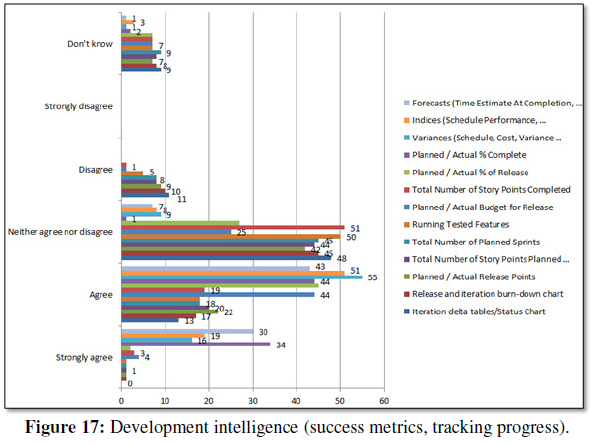
Development Intelligence (Success Metrics, Tracking Progress)
Survey results indicated that respondents strived to a certain extent with regard to addressing the performance metrics and project or program progress tracking. Results confirmed that the traditional EVM measures: variances - schedule, cost, variance at completion (68% responses), indices - schedule performance, cost performance, to-complete performance (63%), status measures - planned / actual % complete (54% agree; 42% strongly agree), and forecasts - time estimate at completion, estimate to complete (53% agree; 37% strongly agree), are predominately considered as performance metrics and development intelligence, as shown in Figure 17.
Agile measures: planned / actual % of release (56% responses), planned / actual budget for release (54%), planned / actual release points (27%), and total number of story points planned / completed (25%), indicate on emerging usage of agile performance measurements. Conversely, it is obvious that a high percentage of respondents are neutral (neither agree nor disagree) with regard to the success metrics offered in the question, indicating either their newness to the agile measures, still predominant usage of traditional EVM measures, or not using measurement at all.
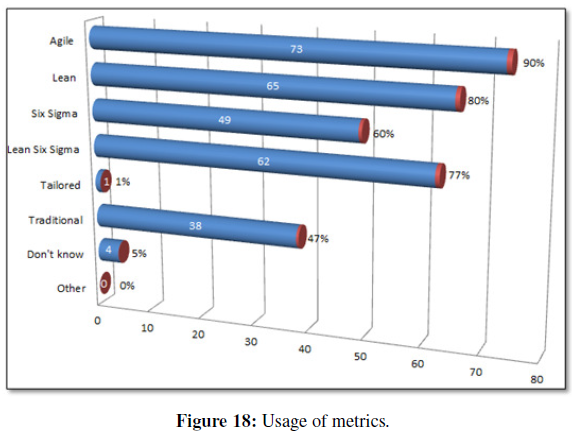
Usage of Metrics
Respondents recognized that predominately lightweight and agile methods use metrics thus providing information to the governing body on their critical performance: 90% agile, 80% Lean, 77% Lean Six Sigma, 60% Six Sigma. Less than half of respondents (47%) indicated that the traditional methods provide sufficient information to the governing body on project / program critical performance. Thus, the key strength of the traditional project management is its tracking metrics toolkit (e.g., Gant charts, work breakdown structure, issue and risk logs), and performance reporting capabilities (e.g., overall status reporting – scope/schedule/cost/quality, or status dashboards with embedded indicators in order to simplify the tracking of projects or programs). (Figure 18)
Notwithstanding, agile methods utilize other metrics, such as feature breakdown structure, iteration status charts, and burn down charts. It also includes agile EVM performance measures with baselines such as number of planned iterations, number of planned stories points in a release, planned budget for the release, total number of story points completed, number of iterations completed, and actual cost of the release.
Possible conclusion from the answers is that project and program management is changing course from predominately traditional into the lightweight project or program management life cycle and its related processes, as response to the organizational pressures in achieving benefits and values.
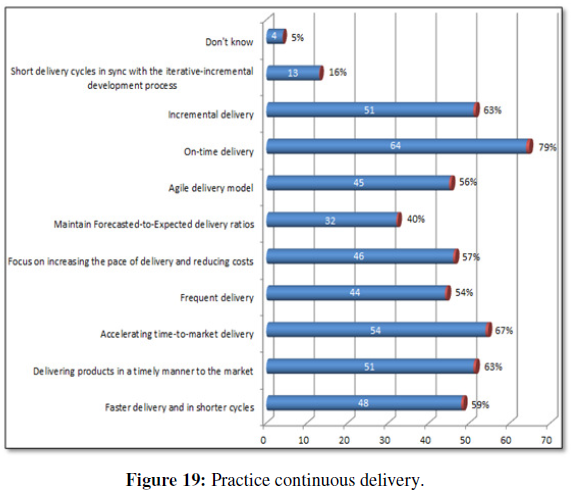
Practice Continuous Delivery
Survey results indicate that on-time delivery (79% responds) is the most important continuous delivery practice for review of the agile project/program performance, followed by accelerating time-to-market delivery (67%), delivering products in a timely manner to the market (63%), incremental delivery (63%),
faster delivery and in shorter cycles (59%), and focus on increasing the pace of delivery and reducing the costs (57%). (Figure 19)
faster delivery and in shorter cycles (59%), and focus on increasing the pace of delivery and reducing the costs (57%). (Figure 19)
As organizations begin specifying values and identifying the entire value streams requesting structural changes, development of a culture of continuous delivery commenced influencing project and program management processes. It can be concluded from the survey results that there is an obvious shift in adopting lightweight practices in addressing increased demands on delivery improvement and ensuring that the rapid changes organizations are going through are sustainable.
Continuous Refinement Toward Greater Efficiencies
Answers indicate that continuous and proactive managerial involvement is the major factor in improving efficiencies (75% respondents agree), followed by openness to changes and willingness to take risks (73%), practice flexible and responsive business strategies (70%), implementing standards that would monitor and sustain policies and guidelines in order to decrease risks for fines (70%), and ensuring higher quality decision making (67%).
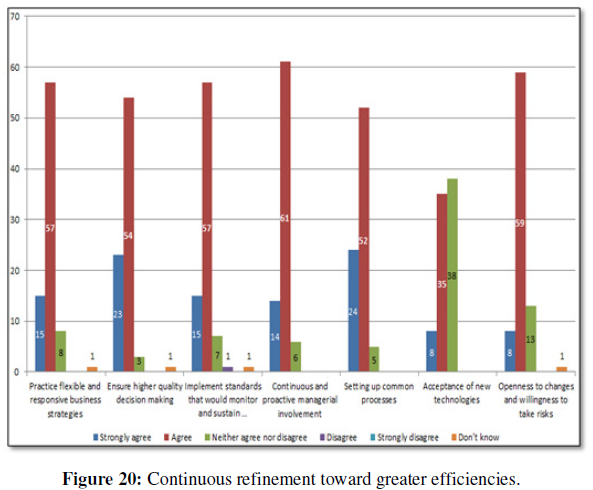
Organizational competitive advantage nowadays comes from continuous, incremental innovation and refinement of traditionally structured processes that undergo a continuous process of incremental change and adaptation. It is indicative that the majority of respondents emphasized that managerial and leadership processes and practices require refinement in order organizations to achieve greater efficiencies, as shown in Figure 20.
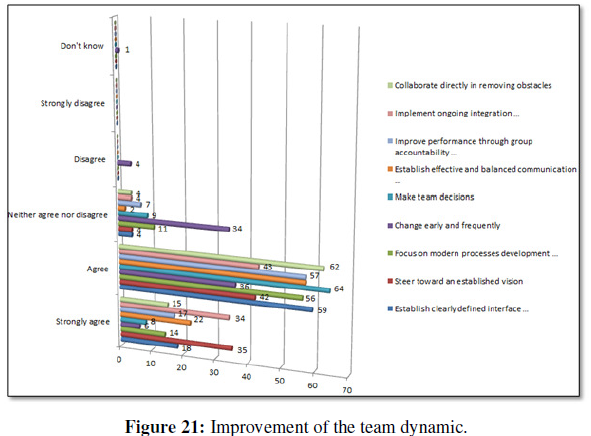
Improvement of the Team Dynamic
Survey results indicated factors that contribute the most to the improvement of team dynamic, as shown in Figure 21: make team decisions (79% respondents), followed by direct collaboration in removing organizational and technical obstacles (77%), establishing clearly defined interface between the project team and the executives (73%), improving performance through group accountability for results and shared responsibility for team effectiveness (70%) and focusing on modern processes development and their management (69%).
esults clearly stipulate that applying lightweight principles of empowering the team and making fact-based decisions through a direct collaboration and established clearly defined relationship with management, leads to the improvement of team dynamic, and consequently to achieving established goals.
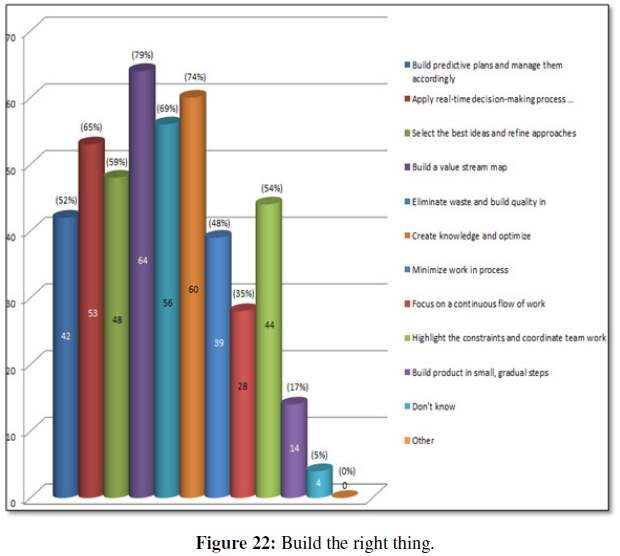
Build the Right Thing
Factors that contribute to a product or service delivery to converge on an optimal customer solution are, based on the survey results, predominately characteristics of the lightweight methodologies: build a value stream map (79% responses), create knowledge and optimize (74%), eliminate waste and build quality in (69%), apply real-time decision-making process based on actual events and information (65%), select the best ideas and refine approaches (59%), and highlight the constraints and coordinate team work (54%).
As shown in Figure 22, it could be concluded that the agile and lightweight principles should be utilized for development and building the optimal customer solutions.
Increase of Benefits and Sustainability
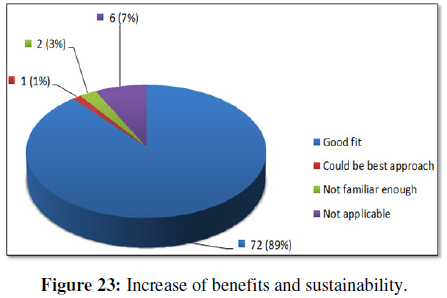
The survey question inquiring from respondents an opinion based on their experience if the agile portfolio governance is a good fit for increasing organizational benefits and therefore sustainability of business values, was descriptive, allowing respondents to enter longer answers. The responds included the following comments: “I believe the agile approach is a power method but not always can satisfy the customer's expectations in creating vision and tracking progress to the expected goals. Agile approach could be best approach in specific environment (context-depending)”; “Could be best approach”; “I am not familiar enough with agile in order to answer”; “Sure”; “Not sure”; “Good fit”; “n/a”; “Agree”; “I agree”; “Yes”; “I think that agile and lean is a good fit”; “Agile is a good fit”. Opinions are further categorized and consolidated in such manner that the category “Good fit” included opinions such as “Agree / Yes / Good fit / Sure”, category “Could be best approach” included opinions “Could be best approach”,
category “Not familiar enough” included opinions “Not familiar enough and Not sure”, and category “Not applicable” included opinions “n/a”, or “not applicable”.
Consolidated opinions are shown in Figure 23. Vast majority of respondents (72 or 89%) consider the agile portfolio governance as a good fit for increasing organizational benefits and sustainable business values. Only minor number of respondents stated that the agile portfolio governance is not applicable (6 respondents or 7%), or not being sufficiently familiar (2 or 3%), and finally 1 respondent expressed the opinion that it could be best approach. It is to conclude that responses indicate the agile portfolio governance and its processes as a good fit for increasing organizational benefits and sustaining business values.
CONCLUSIONS
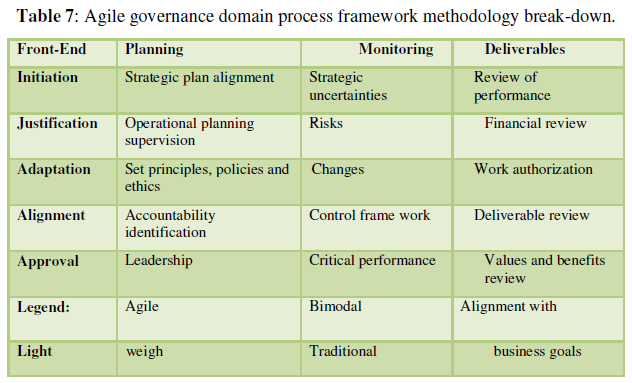
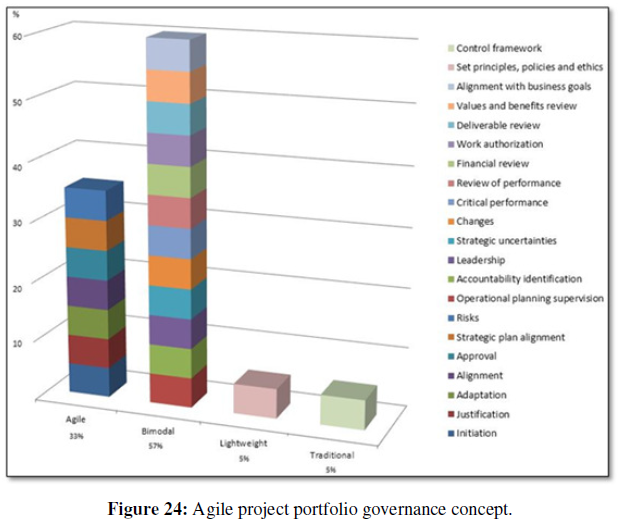
The following agile and lightweight methodologies constitute the agile project portfolio governance domain processes and the agile governance framework, as shown in Table 7:

The governance front-end domain processes are constituted entirely agile. Planning domain processes are constituted agile, lightweight and tailored, or bimodal (mashing agile and lightweight, along with traditional and lightweight methodologies), as well as monitoring domain processes, which are constituted agile, bimodal (mashing agile and lightweight), and traditional methodologies. Deliverable’s domain processes are bimodal (mashing agile and lightweight) entirely. Agile, lightweight, and bimodal agile/lightweight are predominant methodologies (95%) in structuring of the model’s domain processes. There is only one domain process in the model which is traditional – monitoring’s control framework, representing development intelligence (success metrics, tracking progress), or still predominant traditional EVM metrics (forecasts, indices, variances, and status measures). The reason for this could be in the fact that the utilization of the agile representatives of EVM measures (e.g., projected release date, planned release points, release points completed, release date based on mean velocity, or so) are not broadly used yet.
Responses indicated that tailored agile and lightweight (bimodal) methodologies can be seen as the main driver behind the development of the agile project portfolio governance components, as shown in Figure 24. Bimodal agile/lightweight methodologies are admitted as applicable in 12 out of 21 factors influencing the development of agile portfolio governance domain processes (57%). Bimodal approach indicates the significance of the process of methodologies tailoring in order to achieve best fit for the methods, practices and tools chosen at the observed portfolio domain process or component life cycle.
Interesting finding is that tailored methods from the survey haven’t been considered as suitable. This might supervene from the fact that tailored method(s) have not been contextualized, or structured and put in the context in the survey, so the respondents couldn’t evaluate them. Additionally, it could indicate that respondents are custom to the particular methodology (or methodologies) and its processes and practices, and due to certain constraints not inclined considering potential advantages of melded methodologies.
CONCLUSION
With the large benefits, globalization comes with numbers of costs. The main costs are likely to be felt by small and micro businesses that are unable to cope with the increased competition. These small firms are usually operating only at a local level, but are nonetheless affected by the broader international environment. In addition, there will always be gains accruing to some regions or countries which have a more attractive entrepreneurial business environment. This attractiveness is relative to that prevailing in other locations and countries, and relative to the different types of entrepreneur.
A main factor impeding factor of development could be governments themselves. These impediments are difficult to monitor at present, because they are relative, not absolute, and because most are non-border impediments. There need to be better ways of identifying what government regulations and practices are impeding the startup, growth and internationalization of fast growth firms. Because many of these firms are small, and they are “pushing the envelope” in new industries and new technologies they do not show up as significant “blips” on trade negotiation. Governments need to collaborate to set up monitoring systems to identify these impediments, understand their longer-term impact, and establish mechanisms for addressing them, at bilateral and multilateral levels. The success and growth of international SMEs will be enhanced by a more internationalized infrastructure geared to the smooth growth of firms across borders. This applies to the infrastructure for financial markets, advisory services, information access, telecommunications, intellectual property rights markets and regulation, dispute resolution processes, etc. all of which need to be internationalized. All of this requires active collaboration between governments, international agencies and the private sector to address these issues with the view to create a simpler, more business friendly, and more integrated economy at international levels for Indian SMEs.
[1] Survey Quality Predictor, www.sqp.upf.edu
[1] Survey Quality Predictor, www.sqp.upf.edu
[1]Common method variance(cmv) for the simulation was 0.042
- Aruna, N. (2007). Problems faced by micro, small and medium enterprises-A special reference to small entrepreneurs in Vishakapatanam. IOSR Journal of Business and Management 17(4): 43-49.
- European Commission. (2007). ‘Supporting the internationalization of SMEs: Final Report of the Expert Group, Brussels: European Commission Enterprise and Industry Directorate-General.
- MSMED Act. (2006). Available online at: https://samadhaan.msme.gov.in/WriteReadData/DocumentFile/MSMED2006act.pdf
- Neeru Garg. (2014). “Micro Small and Medium enterprises in India: Current Scenario and Challenges”, Paripex-Indian Journal of Research 3(9): 11-13.
- Nishanth, P., Zakkariya, K.A. (2014). “Barriers faced by Micro, Small & Medium enterprises in raising finance”. Abhinav National Monthly Referred Journal of Research in Commerce and Management 3(5):39-46.
- OECD. (1997). Globalisation and SMEs Vols 1 and 2, Paris, Organization for Economic Cooperation and Development (OECD) Publishing.
- OECD-APEC. (2002). Removing Barriers to SME Access to International Markets Paris, Organisation for Economic Cooperation and Development (OECD) Publishing.
- Rajib Lahiri; Problems and Prospects of Micro, Small and Medium enterprises (MSMEs) in India in the era of Globalization; www.rtc.bt/Conference/2012-10…/6
- Sakai, K. (2002). “Global Industrial Restructuring: Implications for Smaller Firms”, STI Working Paper 2002/4, OECD, Paris.
- Sangita, G., Patil, P.T., & Chaudhari (2014). “Problems of Small-Scale Industries in India”, International journal of Engineering and Management Research. Vol.4 (2):19-21.
- Schreyer, P. (1996). “SMEs and Employment Creation: Overview of Selective Qualitative Studies in OECD Member Countries”. STI Working Paper1996/4.
- Shiraleshatti, A.S. (2015). Prospects and Problems of MSMEs in India- A study. International Journal of in Multidisciplinary and Academic Research 1(2): 1-7.
- Suneetha & Sankaraiah, T. (2014). Problems of MSMEs and Entrepreneurs in Kadapa District. IOSR Journal of Economics and Finance 3(2)(I): 31-37.
- Vasu, M.S., & Jayachandra, K. (2014). Growth & Development of MSMEs in India: Prospects & Problems. Indian Journal of Applied Research 4(5).
- Ventakesh, D., & Ventakeshwaralu, M. (2017). An overview of the Indian Sugar Industry. BIMS International Journal of Social Science Research 11-16.
-
 Table 1
 -
Table 2
-
Table 3
-
Table 4
-
Table 5
-
Table 6