735
Views & Citations10
Likes & Shares
This review is about the functional and automatic segmentation methods for biomedical imageries. To improve the desired results, the data density method was incorporated and is very significant in calculating even in pixels. This paper successfully describes combinational technique for solving the segmentation problem of magnetic resonance imaging (MRI) datasets.
REVIEW
Reliable and robust automatic method of image segmentation is still an open problem. To alleviate the undesired consequences from biomedical image segmentation processing, data density functional method made an avenue for measuring the desired connectivity and significance from pixel points within imageries and even within image clusters using the concept of energy functional densities, and then the corresponding clustering morphologies can be visually exhibited in an energy space [1]. By employing any sophisticated probability density estimator, the most probable cluster number and the most probable corresponding cluster boundaries can be extracted simultaneously. Furthermore, as similar as the concept of level set [2,3], the components of the imagery of interest located within similar energy region can be segmented by labeling their corresponding energy values. Eventually, these components will be either merged or segmented by considering their connectivity levels.
Several suspect technical predicaments might degrade the performance or functions of contemporary segmentation methods. For instance, in modern biomedical imaging processes, whatever gray level-typed images, coloring images, or sparse matrix images, each successive digitized image ideally needs to be aligned with previous and subsequent images [4-8]. In the duration of image processing, the images might suffer rotating or stretching when they were processed in measurement and imaging. Meanwhile, the components in the same tissue volume might also have different pixel intensity within films. Thus, the degradation of uniformity and contrast of the pixel intensity would limit the performance of the segmentations.
In other hands, labeling of the pixels is also a considerable problem [5,7,9-19]. For instance, the snaking neurons in a Brainbow system [1] stitch confusedly intertwining patterns, thus the chrominance within an imaging voxel would be possibly contaminated by adjacent components. Severe color crosstalk tends to undesirably penalize spurious branches and premature terminations when the image resolution is compromised [1,6,13,20]. Saturated luminous intensity within the voxels can probably cause not only topological errors on neural clustering but also the bogus neural connectivity. The ambiguous regions within the pixels due to the mentioned problems would cause the difficulty of image clustering and then the inaccuracy segmentation.
The merit of employing the data density functional method might elegantly solve the mentioned predicaments. By mapping the image pixel intensity into a specific energy space, the degradation of uniformity and contrast of the pixel intensity might be efficiently alleviated by introducing the action of connectivity from potential energy functional density. Meanwhile, the image pixels having color contamination and intensity saturation would be regularized by introducing the kinetic energy functional density. In a nutshell, by employing the data density functional method associated with the intrinsic properties of connectivity and significance within biomedical pixel points, the paper proposes a method of segmentation for biomedical imageries of interest. The data density functional method, based on the mathematical framework of quantum chemistry, has a sophisticated and pragmatic characteristic to easily connect to the theoretical framework of contemporary methods in the field of machine learning. Thus, the relevant techniques from machine learning methods can be used to reinforce the performance of the data density functional method.
In the paper, we successfully used the proposed combinational technique for solving the segmentation
problem of magnetic resonance imaging (MRI) datasets. The connectivity and significance of the employed MRI dataset were respectively estimated by means of the corresponding data functional densities [1]:
u[ρ]=∑_(n=1)^(W×H)▒M_n⁄|r^'-r_n^' |_(r^'≠r_n^' ) , (1)
and
[𝜌] = 𝜋2𝜌. (2)
where 𝑊 and 𝐻 are respectively the width and height of an image, 𝒓′ and 𝒓′are respectively the positions of the 𝑛th pieel and the observation point, and 𝑀𝑛 is the corresponding normalized intensity. Then, the input pixel intensity was
ρ(r^' )=∑_(n=1)^(W×H)▒〖M_n×δ(r^'-r_n^' ) 〗 (3)
Eventually, the employed MRI dataset was segmented by considering the connectivity levels of components:
ℒ[𝜌] = 𝛾2𝑡[𝜌] − 𝛾𝑢[𝜌], (4)
γ=1/2 〈u[ρ]〉/〈t[ρ]〉 (5)
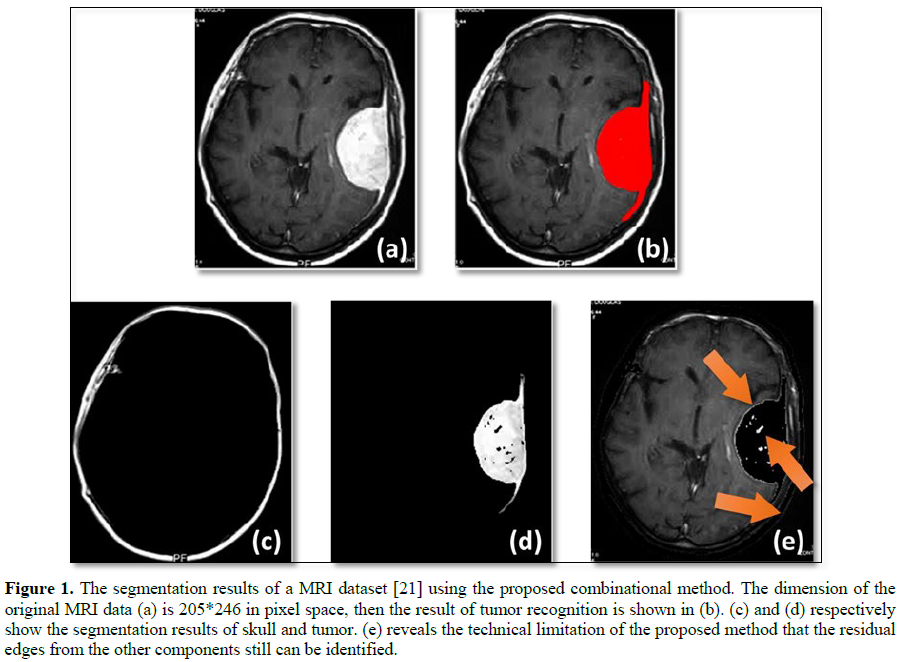
The consequence is shown in Fig. 1, wherein the mean value of the ℒ[𝜌] was used to be a threshold to segment the skull and tumor from the normal tissues. Main parts of the image as shown in Figure 1(a), such as skull and tissues, were totally segmented as well as the other parts of brain tumors.
The skull in (c), normal tissues in (e), and the tumor in (b) and (d) of Figure 1 were successfully segmented using the data density functional method. The MRI dataset was sourced from the open data [21]. The Figure 1 (e) also had shown a limitation of the proposed combinational method. As shown by the arrows, the residual edges from tumor and skull are respectively still mixed with the brain tissue.
ACKNOWLEDGEMENT
We would like to acknowledge the support from Veterans General Hospitals and University System of Taiwan Joint Research Program (VGHUST107-G4-2-2). We also thank Dr. Manu B. N. for providing the high quality magnetic resonance imaging datasets.
1.
Chen CC, Juan HH, Tsai MY, Lu H HS (2018) Unsupervised Learning and Pattern Recognition of Biological Data
Structures with Density Functional Theory and Machine Learning. Sci Rep 8: 10.
2.
Dubrovina-Karni A, Rosman G, and Kimmel R (2015) Multi-Region
Active Contours with a Single Level Set Function. IEEE Trans. Pattern Anal Mach Intell 37: 1585-1601.
3.
Chan TF, Vese LA (2001) Active Contours Without Edges. IEEE Trans. Image Process
10: 266-277.
4.
Hsu Y, Lu H HS (2013)
Brainbow image segmentation using Bayesian sequential partitioning. Int J Computer Information
Systems Control Eng 7: 891-896.
5.
Lichtman JW, Pfister H, Shavit N (2014) The big data
challenges of connectomics. Nat. Neurosci. Vol. 17: 1448-1454.
6.
Wu TY, Juan HH, Lu H HS, Chiang AS (2011) A
crosstalk tolerated neural segmentation methodology for brainbow images. ACM
ISABEL.
7.
Kaynig V (2015) Large-scale automatic reconstruction of neuronal processes from
electron microscopy images. Med. Image. Anal 22: 77-88.
8.
Nunez-Iglesias J, Kennedy R, Plaza SM, Chakraborty A,
Katz WT (2014) Graph-based active learning of agglomeration (GALA): a Python
library to segment 2D and 3D neuroimages. Front Neuroinform 8: 1-6.
9.
Bas E, Erdogmus D, Draft RW, Lichtman JW (2012) Local
tracing of curvilinear structures in volumetric color images: Application to
the Brainbow analysis. J Vis Commun Image R 23: 1260-1271.
10.
Bas E, Erdogmus D (2010) Piecewise linear cylinder
models for 3-dimensional axon segmentation in Brainbow imagery. ISBI 1297-1300.
11.
Vasilkoski Z, Stepanyants A (2009) Detection of the
optimal neuron traces in confocal microscopy images. J. Neurosci. Meth. Vol.
178: 197-204.
12.
Wang Y, Narayanaswamy A, Tsai CL, Roysam B (2011) A
broadly applicable 3-D neuron tracing method based on open-curve snake.
Neuroinform 9: 193-217.
13.
Türetken E (2013) Reconstructing loopy curvilinear
structures using integer programming. IEEE CVPR 1822-1829.
14.
Gala R (2014) Active learning of neuron morphology for
accurate automated tracing of neurites. FNANA Vol. 8: 1-14.
15.
Chothani P, Mehta V, Stepanyants A (2011) Automated
tracing of neurites from light microscopy stacks of images. Neuroinform. Vol.
9: 263-278.
16.
Türetken E, González G, Blum C, Fua P (2011) Automated
reconstruction of dendritic and axonal trees by global optimization with
geometric priors. Neuroinform. 9: 279-302.
17.
Zhang Y (2010) A neurocomputational method for fully
automated 3D dendritic spine detection and segmentation of medium-sized spiny
neurons. NeuronImage 50: 1472-1484.
18.
Peng H, Long F, Myers G (2011) Automatic 3D neuron
tracing using all-path pruning. Bioinformatics Vol. 27: i239-i247.
19.
Rodriguez A, Ehlenberger DB, Hof PR, Wearne SL (2009)
Three-dimensional neuron tracing by voxel scooping. J. Neurosci. Meth. Vol.
184: 169-175.
20.
Shao HC, Cheng WY, Chen YC, Hwang WL (2012) Colored
multi-neuron image processing for segmenting and tracing neural circuits. ICIP
2025-2028.
21.
Manu BN (2016) Brain MRI Tumor Detection and
Classification. MathWorks®.
QUICK LINKS
- SUBMIT MANUSCRIPT
- RECOMMEND THE JOURNAL
-
SUBSCRIBE FOR ALERTS
RELATED JOURNALS
- Journal of Astronomy and Space Research
- Journal of Microbiology and Microbial Infections (ISSN: 2689-7660)
- Journal of Genetics and Cell Biology (ISSN:2639-3360)
- Food and Nutrition-Current Research (ISSN:2638-1095)
- Journal of Womens Health and Safety Research (ISSN:2577-1388)
- Journal of Genomic Medicine and Pharmacogenomics (ISSN:2474-4670)
- Journal of Veterinary and Marine Sciences (ISSN: 2689-7830)