2748
Views & Citations1748
Likes & Shares
In this study, we have used patient-specific computed tomography angiography data to produce idealized coronary artery models with different left anterior descending (LAD) and left circumflex (LCx) arteries with various bifurcation angles and degrees of stenosis. Since coronary artery stenosis and bifurcation angles are closely associated to myocardial infarction (heart attack), the main goal of this study is to analyze whether the bifurcation angles have an impact in the coronary blood flow.
Six idealized models have constructed with two arterial bifurcation angles, 93° and 75°. Those models are; one healthy model and two diseased (1 stenosis model and 2 stenosis model) models, for each arterial bifurcation angles 93° and 75° respectively. After reconstructing the computational models, numerical studies have been performed to obtain the hemodynamics parameters, such as velocity magnitudes, pressure gradients and fractional flow reserve (FFR). FFR measures the severity of stenosis in the idealized models.
We used the finite element method to provide concise and comprehensive solution over the curved surfaces. From the detailed simulation results, the information of the hemodynamic parameters is compared with the clinical data for validating the obtained results. From the simulated idealized models, we notice that due to the stenosis in the main LAD artery the blood flow is much higher in the bifurcated stenosis region than other locations in the 3D stenosis model. From the FFR value which is measured as the ratio of the downstream and upstream pressure, we observe that the severity of stenosis is much higher for the arterial bifurcation with larger angle 93°.
Severity of stenosis differs for different angles in the diseased (stenosed) models. So, the computational hemodynamics (CHD) parameters provide information about the condition of stenosis in the idealized models and can give a clearer insight about the blood circulation in the human body.
So, this is worthy of investigation as it has influence on the propagation of coronary artery disease (CAD). Thus, more accurate simulation results may predict the patient conditions and it might be replaced with the invasive test catheterization for the diagnosis of the disease for evaluating FFR in the future.
Keywords: Fractional flow reserve (FFR), Left anterior descending (LAD), Coronary artery, Myocardial infarction
INTRODUCTION
Cardiovascular disease (CAD) is a serious heart condition affecting many developed countries in the world and resulting in high morbidity rates [1]. It is usually caused by breakdown in the normal cardiovascular functions and including abnormal flow situations. One of the most common causes of CAD is atherosclerosis, which is the disease of the vascular system [2,3].
It is a cardiovascular condition that can occur in any part of the vascular system. Especially, it can exist in bifurcated arteries such as the left and right coronary arteries, abdominal aortic bifurcation or carotid artery bifurcation. In this study, the left coronary artery is examined as an exemplification using wall shear stress (WSS) and pressure gradient (PG). An attempt has been made to find the relationship between bifurcated arterial geometry and hemodynamics. The result demonstrated that the region of low WSS area and magnitudes of maximum PG increases with the bifurcation angles [4].
The most common type of CAD is coronary artery stenosis which is initiated by the build-up of plaques on the endothelial walls of coronary arteries. It leads to a reduction in arteries cross-sectional area and blood supply to the myocardium [5]. The rapid development of noninvasive imaging technologies, such as computed tomography angiography (CTA) and magnetic resonance imaging (MRI), has proven valuable to characterize the anatomic severity of CAD with fair cost and less complication [6].
This study proposes a noninvasive method to determine fractional flow reserve (FFR) by combining computed tomography angiographic (CTA) data and computational fluid dynamics (CFD) technique. Hence in this study the effects of diameter stenosis (DS), stenosis length and location on FFR has been explored. Diameter stenosis (DS) is commonly applied to quantify the anatomic severity of CAD. It expresses the ratio of the lumen diameter at a stenotic region over that of a “normal” segment [7].
Recent coronary computed tomography angiography (CCTA) studies have noted higher transluminal contrast agent gradients in arteries with stenotic lesions, but the physical mechanism responsible for these gradients is not clear. In its current form, CCTA is used to identify arterial stenosis as well as to evaluate the size, shape and area reduction due to the lesion. This information is subsequently used to make decisions on surgical intervention as well as to plan the surgery. However, this approach does not provide any information about the coronary hemodynamics, such as velocity or pressure drop across the lesion, which is a more direct measure of the functional significance of the arterial lesion and the resulting ischemia. CFD modeling coupled with contrast agent dispersion has been used to investigate the mechanism for contrast agent gradients [8].
Currently, there are no reliable ways to predict an aneurysm. Multiple studies have been performed to determine the etiology of aneurysms, but all of them have been inconclusive. In this study the occurrence of aneurysms in the main middle cerebral artery (MCA) to asymmetry between the bifurcation angles has been analyzed. Hence using MCA models, the morphological differences have been found examining the changes in the fluid flow and wall shear stress [9].
The causes of atherosclerosis are multifactorial and identification of these factors could allow earlier detection and prevention of the disease. Hemodynamics and vessel geometry may play an important role in the cause of plaque formation since atherosclerotic plaques occur frequently in well-recognized arterial regions of curvature, bifurcated area and vessel branches [10].
Blood flow variations, particularly those related to the rate of change of stream-wise velocity perpendicular to the blood vessel wall (known as the wall shear stress), have been reported to be related to the pathogenesis of atherosclerosis [11]. The purpose of this study was to investigate the hemodynamic effect of variations in the angulations of the left coronary artery, based on simulated and realistic coronary artery models. Twelve models consisting of four realistic and eight simulated coronary artery geometries were generated with the inclusion of left main stem, left anterior descending (LAD) and left circumflex (LCx) branches. The simulated models included coronary artery angulations and CFD analysis were performed to simulate realistic physiological conditions that reflect in the vivo cardiac hemodynamics. The WSS, velocity flow patterns and wall pressure were measured in simulated and realistic models during the cardiac cycle. The results show that a disturbed flow pattern is observed in models with wider angulations, and wall pressure is found to reduce when the flow changed from the left main stem to the bifurcated regions, based on simulated and realistic models. There is a direct correlation between coronary angulations and subsequent hemodynamic changes, based on realistic and simulated models [12].
Development of many conditions and disorders, such as atherosclerosis and stroke, are dependent upon hemodynamic forces. To accurately predict and prevent these conditions and disorders hemodynamic forces must be properly mapped. In this study, a comparative shear-rate dependent fluid (SDF) constitutive model, based on the works by Yasuda et al. [13] in 1981, against a Newtonian model of blood is analyzed. Numerical simulations show that the Newtonian model gives similar velocity profiles in the 2D cavity given different height and width dimensions, given the same Reynolds number. Conversely, the SDF model gave dissimilar velocity profiles, differing from the Newtonian velocity profiles by up to 25% in velocity magnitudes. This difference affect estimation in platelet distribution within blood vessels and magnetic nanoparticle delivery.
Arteries are normally straight to efficiently transport blood to distal organs. However, arteries may become tortuosity as a result of arterial remodeling [14]. Tortuosity is widely observed in coronary arteries [15,16]. Tortuous coronary arteries may hamper the ventricular function and have been proposed as an indicator of the ventricular dysfunction [17]. Coronary tortuosity (CT) is associated with reversible myocardial perfusion defects and chronic stable angina [18,19].
Tortuous coronary arteries are commonly observed in clinical screenings and it may cause a reduction of the coronary pressure. However, whether this reduction leads to significant decreasing in the coronary blood supply is still unknown. The purpose of this study was to investigate the effect of the coronary tortuosity (CT) on the coronary blood supply. CFD is conducted to evaluate the impact of tortuosity on the coronary blood supply. Two patient-specific LAD models and the corresponding non-tortuous models are reconstructed to perform three dimensional CFD analysis. The lumped parameter model is coupled to the outlet of the simulated branches to represent the absent downstream vasculatures. The rest and exercise conditions are modeled by specifying proper boundary conditions. Under resting condition, the mean flow rate could be maintained by decreasing less than 8% of the downstream vascular bed’s resistance for tortuous models. While during exercise (maximal dilation condition), the maximal coronary blood supply would reduce up to 14.9% due to tortuosity. Assuming that the flow rate can be maintained by the autoregulation effect under the maximal dilation condition, the distal resistances for CT models still have to reduce more than 23% to maintain blood perfusion [20].
CAD is responsible for 7.3 million deaths and 58 million disability-adjusted life years lost worldwide [21]. It is generally accepted that CAD is an inflammatory disease with lipid deposition in the arterial wall as an initial stage of atherosclerosis [22-25]. Although the risk factors for atherosclerotic coronary plaque formation, including high cholesterol, diabetes and hypertension are systemic in nature, plaques are located at specific sites in the coronary artery where distributed flow and low endothelial shear stress occur [26, 27]. This study provides an overview of the CFD applications in CAD, including biomechanics of atherosclerotic plaques, plaque progression and rupture; regional hemodynamics relative to plaque location and composition [28].
Blood flow in arteries is dominated by unsteady flow phenomena. The cardiovascular system is an internal flow loop with multiple branches in which a complex liquid circulates. A non-dimensional frequency parameter, the Womersley number, governs the relationship between the convective and viscous forces. The arteries are living organs that can adapt to and change with the varying hemodynamic conditions. In certain circumstances, unusual hemodynamic conditions create an abnormal biological response. Velocity profiles skewing can create pockets in which the direction of the wall shear stress oscillates. Atherosclerotic disease tends to be localized in these sites and results in a narrowing of the artery lumen-a stenosis. The stenosis can cause turbulence and reduce flow by means of viscous head losses and flow choking. Very high shear stresses near the throat of the stenosis can activate platelets and thereby induce thrombosis, which can totally block blood flow to the heart or brain [29].
The CFD enabled the simulation of coronary blood flow conditions in idealized and patient-based coronary models. The simulation allows to produce a non-invasive assessment of the hemodynamic parameters, such as blood velocity magnitude, relative pressure difference and FFR. Hence these hemodynamic mechanisms provide the information on coronary stenosis conditions and predict the severity of coronary arterial lumen area which is responsible for the heart attack of the patients. In the results, the expected outcomes in both cases, for instance, a higher blood velocity in the coronary vessels tends to stretch the contrast agent gradient and a lower blood velocity magnitude tends to steepen the contrast agent gradient has been reflected. The pressure difference and FFR results allow to distinguish the unstenosed and stenosis arterial models [30].
MODEL GENERATIONS
Construction of idealized 3D models
It is quite clear that most of the coronary main arteries are bifurcated everywhere. In the most cases stenosis occurs near the bifurcations or artery bending regions. To describe these characteristics, we construct an idealized model imitating patient-specific computed tomography coronary artery angiography model with different left anterior descending (LAD) and left circumflex (LCx) arteries. In this study, the 3D idealized models are generated by computer-aided design software FreeCAD and then the models are imported into COMSOL Multiphysics software, for grid generation and simulation. The models are made to match images of the coronary artery bifurcation during operations or imaging since no digital scans are available to import into COMSOL. The 3D idealized models are built using FreeCAD software. The idealized 3D model consists of two main arteries which are LAD and LCx, each with one side branch. The length of LAD is 20 cm and the length of LCx is 14 cm. The branch from LAD artery has length 5 cm and the branch from LCx artery has length 7 cm. The structure and dimension of the models are based generally on a typical left coronary artery that follows the anatomically close information.
To curve the models, we use B-splines which are easy to represent the bending nature of the LAD, LCx arteries and the side branches. For building the arterial tube we use again B-splines with the same center but different radius. Taking the difference of radii, we build the arterial wall that is rigid inside for the blood flow. Using Boolean functions, we can get accurate shapes of the 3D idealized models. In the diseased model the stenoses are generated using the software.
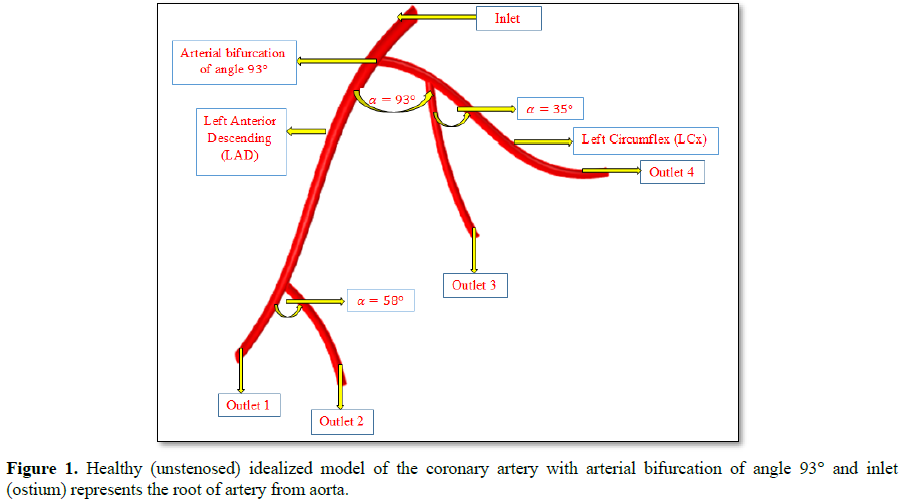
This computational idealized model contains one inlet and four outlets that are represented by outlet 1, outlet 2, outlet 3 and outlet 4, respectively. The radius of inlet is 2.5 mm and the radius of outlets 1 and 2 is 1.8 mm and 1.7 mm respectively. Again, the radius of outlets 3 and 4 is 1 mm each.
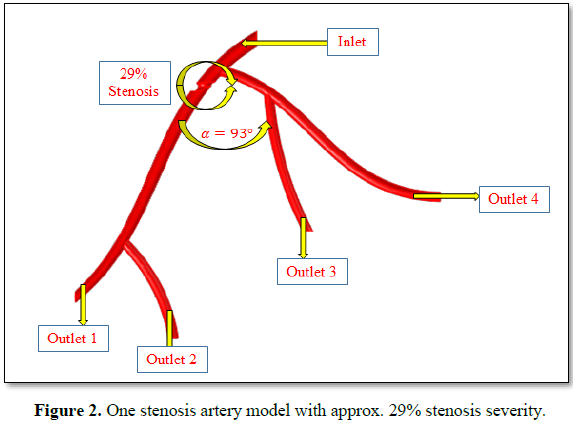
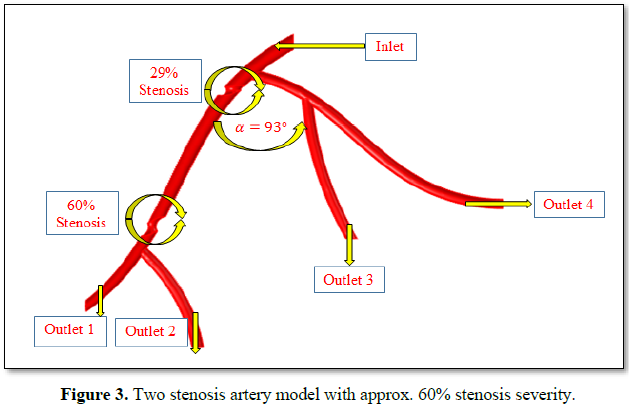
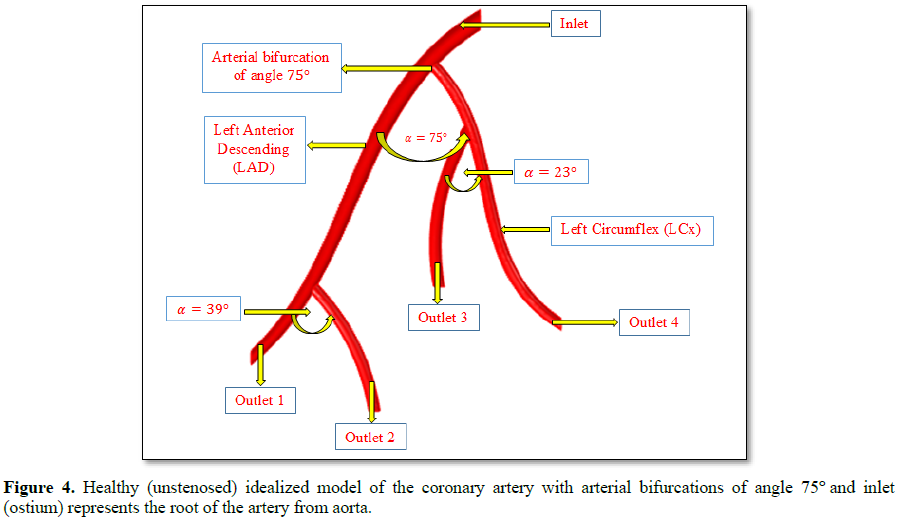
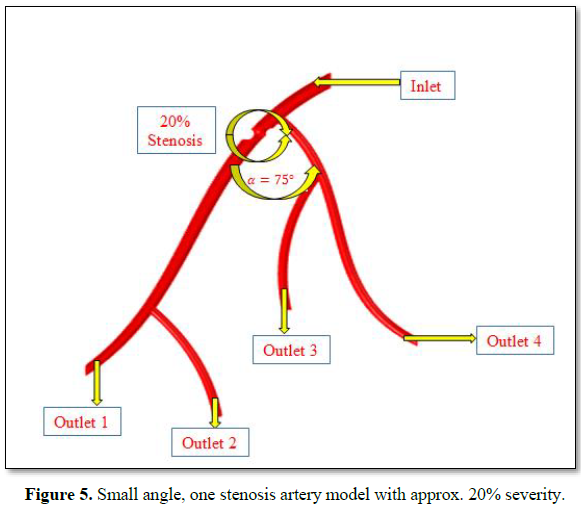
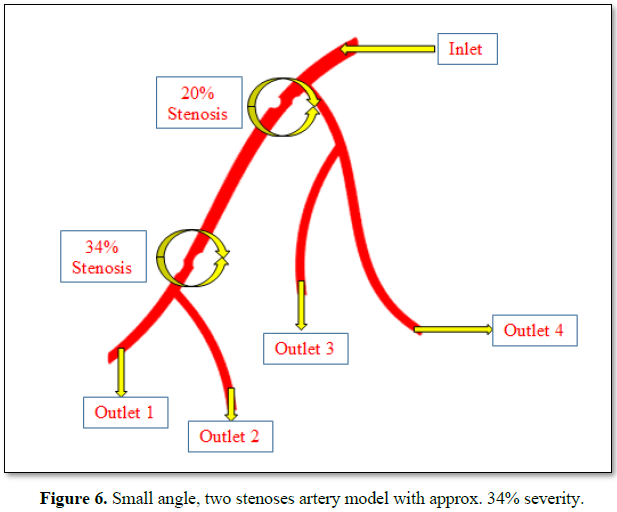
We construct six computational idealized models. The first 3 models are constructed where we choose that the arterial bifurcation is 93°.These 3 models are: healthy (unstenosed) model and two diseased models (one stenosis model and a model with two stenoses). In the healthy (unstenosed) idealized model the measured angle between LAD artery and its side branch is 58° (Figure 1) and the measured angle between LCx artery and its side branch is 35°. We have measured these angles using FreeCAD software. In one stenosis model the first stenosis is located just after the arterial bifurcation where the stenosis severity (area reduction) is approximately 29% (Figure 2). In the two stenoses model, the second stenosis is located above the branch of the LAD artery where the stenosis severity is approx. 60% (Figure 3). For using the finite element method (FEM), it is better to save the model in STEP file format that produces smooth boundary walls with inlet and outlets in the domains of interest. Another set of 3 models are constructed where we choose the arterial bifurcation of angle 75°. Those 3 models are again: healthy (unstenosed) model, (Figure 4) and two diseased models. In the healthy idealized model, the measured angle between LAD artery and its side branch is 39° and the measured angle between LCx artery and its side branch is 23°. In the one stenosis model the first stenosis is located just after the arterial bifurcation where the stenosis severity (area reduction) is approximately 20%, (Figure 5). In the two stenoses model, the second stenosis is located above the branch of the LAD artery where the stenosis severity is around 34% (Figure 6).
Grid generation in 3D idealized models
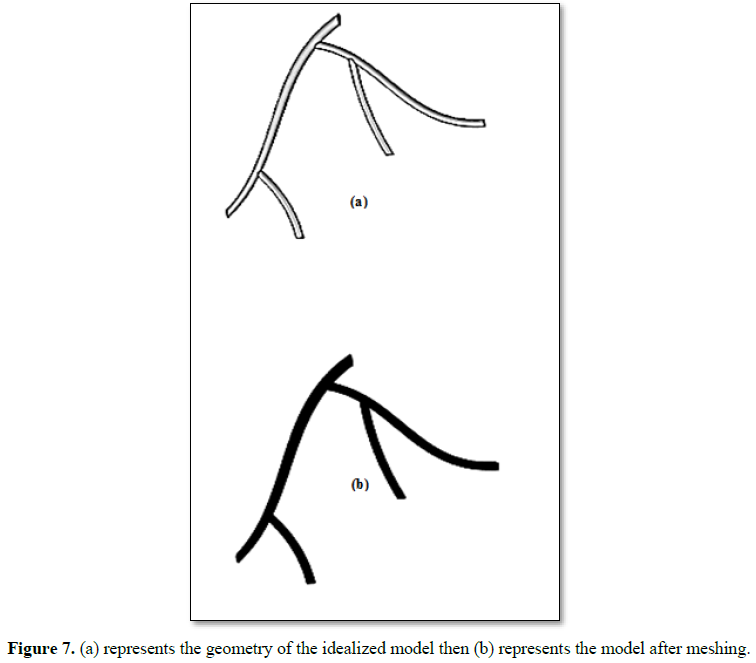
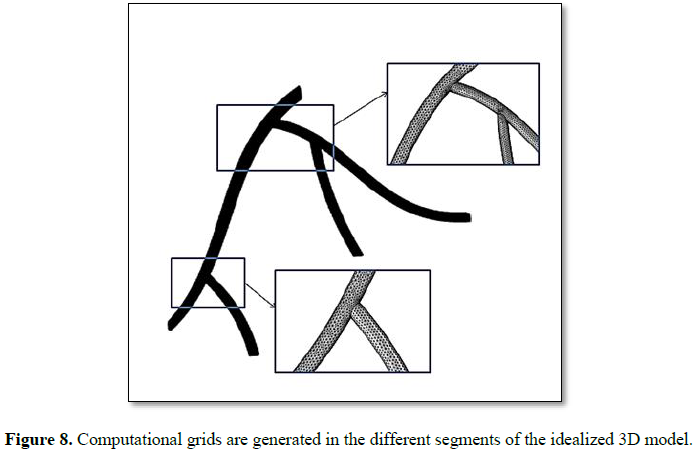
Once all the models are prepared, a mesh analysis is performed to find the maximum and minimum mesh required to get accurate results. The models are simulated for one cardiac cycle at various mesh settings until required convergence is achieved (Figure 7, 8). Our idealized 3D model has uniform shape in this case; finite elements mesh generation provides a concise and comprehensive solution over curved surfaces and 3D volume cells. We import the step file under the FEM simulation software where the surface and boundary areas are the unstructured adaptive triangular cells and tetrahedral cells. The mesh settings that are used COMSOL’s predefined finer mesh size for fluid dynamics. Some minor alterations to the mesh settings are performed to remove unneeded elements and nodes, and to increase element density around the apex of coronary artery bifurcation.
The domain is set to the predefined finer setting. This setting created a gradient in element size with smaller elements being on the boundaries of the model and larger elements in the middle of the domain. Meshing gets finer closer to the boundary because the fluid velocity reduces rapidly as it approaches to the wall, no slip condition. The predefined mesh fluid dynamic settings also added a layer of elements between the boundary and the domain. In all models we have used tetrahedral elements. Tetrahedral elements are used for the domain since they model accurately complex 3D structures. An internal volume of boundaries is covered by unstructured tetrahedral domain cells where the largest cell size is 1.2 mm and the smallest cells are 0.7 mm. The finer meshing gives high-quality elements that improve numerical stability and increases the likelihood of attaining a reliable solution. In the whole domain, the amount of mesh is 6.67877×10⁵ elements, where 75164 in the fluid zone, 53966 in boundary elements and 1825 are edge elements. The other parameter settings of the meshing are the growth rate, defined as 1.2, the curvature factor 0.6 and resolution in narrow regions is zero.
Arterial input function and numerical simulation
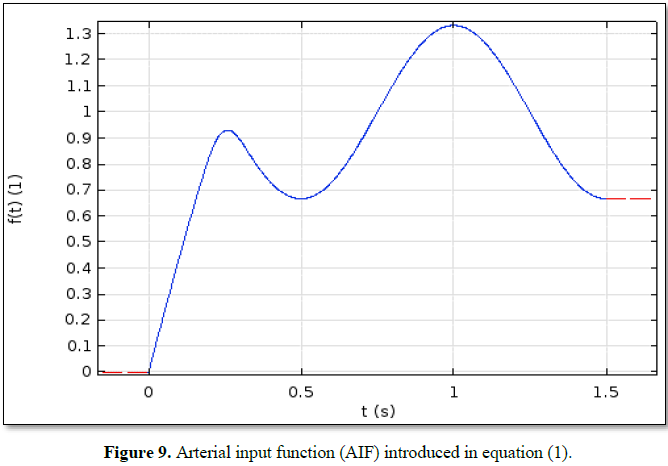
Quantification of tissue perfusion relies on the determination of arterial input function (AIF). The choice of AIF can have a profound effect on the blood flow maps generated on perfusion-weighted MR imaging. Automation of this process could substantially reduce operator dependency and increase consistency. AIF plays an important role to measure the concentration of blood contrast agent under the time-independent condition at the outset position of the coronary artery. The erroneous determination of the AIF could result in miscalculation of perfusion parameters.
We use the following equation as AIF:
f(t) = { (1.75-α) sin (πt), 0 ≤ t ≤ 0.20 (1)
1-α cos(2π(t-0.5)), 0.20≤ t ≤ 1.5
Equation (1) is a simple trigonometric function, is the relative pressure amplitude. During a cardiac cycle the pressure varies between a minimal and a maximal value which are calculated through a relative amplitude, . The first piece of function between 0 and 0.20 s, has no physical significance, it is just a ramp that enable to calculate the initial state. The second piece of function makes the pressure vary between its minimal and maximal value during a 1 s cardiac cycle. The numerical simulations are performed for the blood flows with the area of stenosis around 20% and 60%. The computational results provide the pressure and velocity magnitudes for the idealized coronary artery model. The arterial input function is shown in Figure 9. To simulate the idealized models, we consider two materials; muscle and blood where muscle is set to domain 1 and blood is set to domain 2. Here we employed the blood density as 1060 kg/m3 and laminar flow with the Reynolds number as 140. The Lame parameters relates stresses and strains in perpendicular directions which is closely interacted to the incompressibility and contains a high proportion of information about the resistance to a change in volume caused by a change in pressure. In our study the Lame parameter handles the artificial tube stress and strain of the arterial elasticity. To simulate the idealized models the inlet and outlets follow a Neumann type boundary condition. The walls of the models are set to rigid with no slip condition. At the inlet, we have set the velocity as 16.1 cm/s and at the outlets, we have set the pressure approx. 3 mmHg [30].
In a clinical study on coronary artery blood flow, the average blood velocity of LAD is measured as 17.98 ± 5.66 cm/s using digital tracing coronary angiography [31]. We compare the simulation results with the clinical data [31] for angles 93°and 73° with the flow velocity in cm/s. For the arterial bifurcation with angles 93° and 75° we calculate the flow velocity using the same approach for materials, boundary conditions and mesh generation.
RESULTS AND DISCUSSION
We present a comparative study between healthy (unstenosed) and diseased (one stenosis model and a model with two stenoses) models for describing coronary blood flow. We display our simulation results of hemodynamics parameters (velocity magnitudes, pressure difference). For validation purposes, we also compared our data with literature [30]. Additionally, we calculate FFR value from the pressure difference. Hence, from FFR value we measure the severity of stenosis of the idealized coronary artery models. We finally discuss the effect of bifurcation angles of stenosis in coronary blood flow of the models.
Post processing, visualization and data comparison
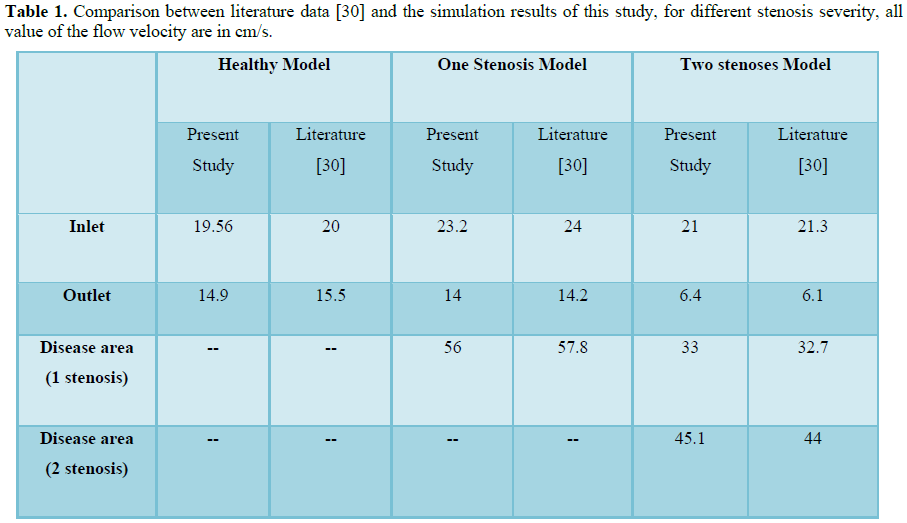
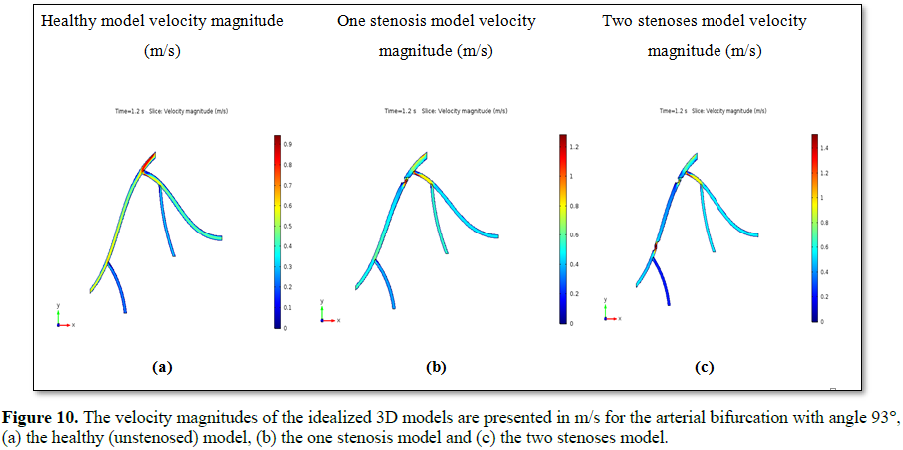
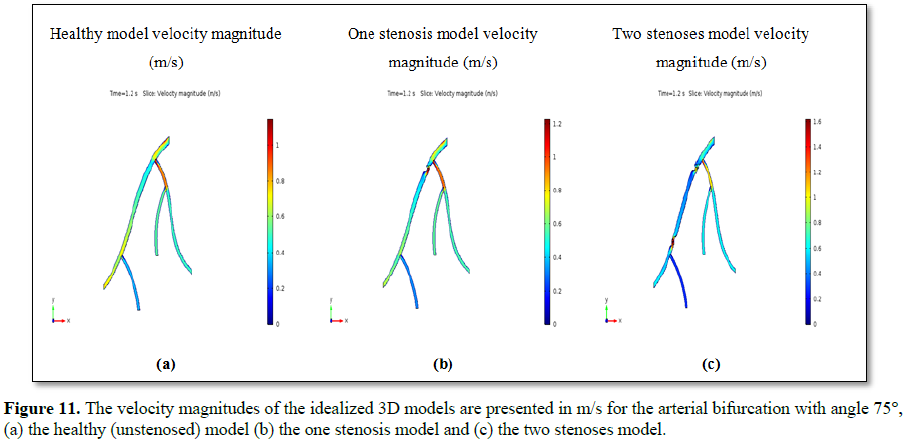
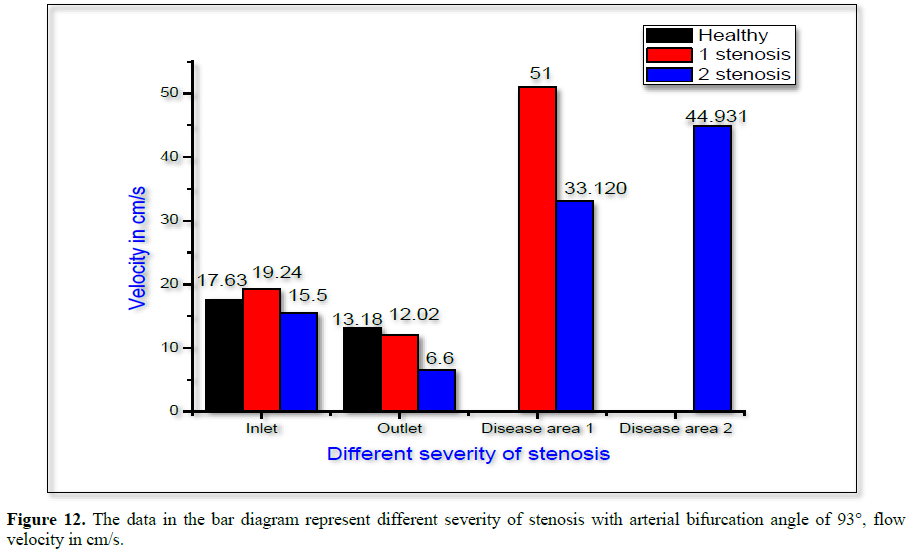
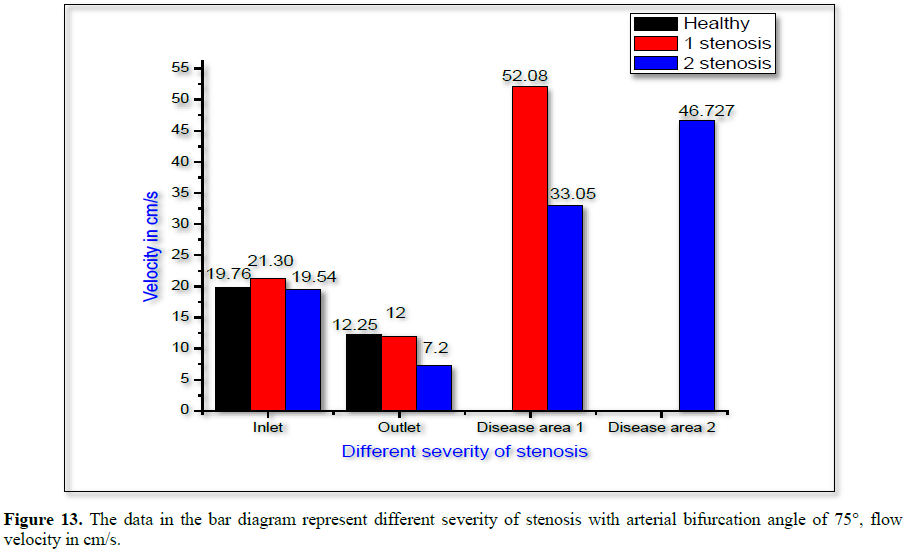
The CFD solver provides the simulation results, with the appropriate physical properties and boundary conditions as described before [30]. The presented solutions in this section rely on information such as which solver is selected and which component the solution applies to (for models with multiple components). Figure 10 shows the velocity magnitudes for the arterial bifurcation with angle 93° of the healthy, one stenosis model and two stenoses idealized model. Figure 11 presents the velocity magnitudes for the arterial bifurcation with the smaller angle 75°, of healthy, one stenosis and two stenoses idealized models. From both Figures 10 and 11, we observe that the upstream and downstream velocity difference is more pronounced in the stenosis area. Again, from Figures 12 and 13, we observe that due to the stenosis in LAD artery, blood velocity is much higher in the stenosis area than other locations (Table 1).
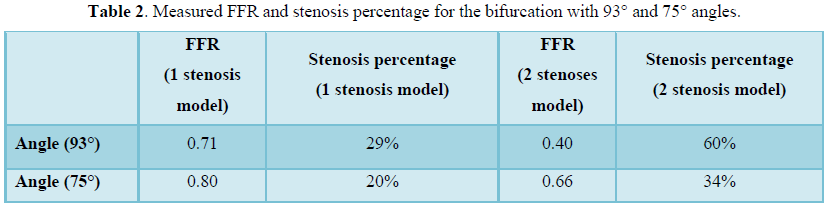
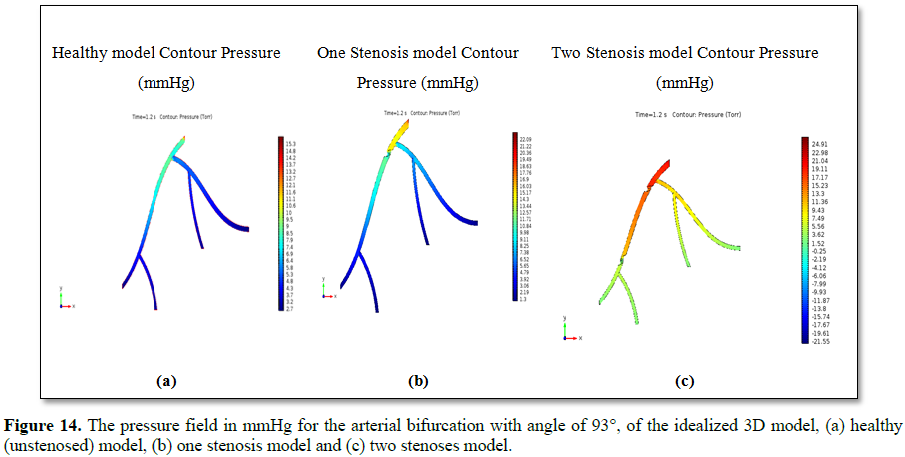
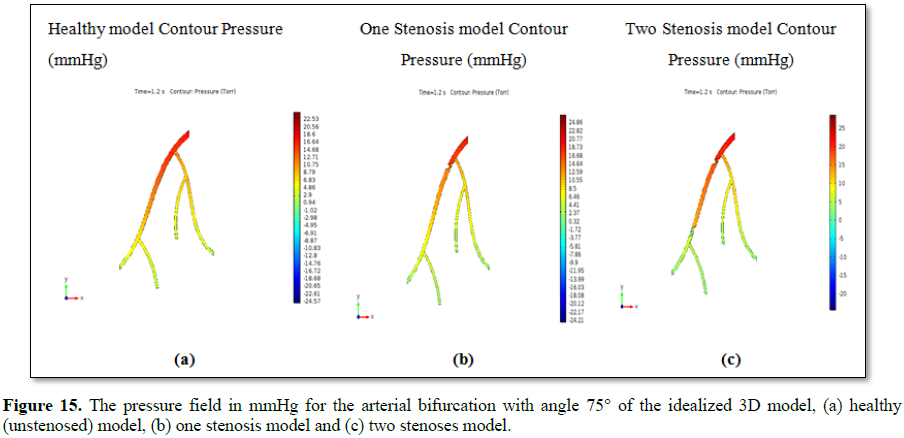
Figures 14 and 15 present the simulation result of the pressure field in the arteries under consideration. Figures 14 and 15 present the pressure gradient in the six idealized models. The relative pressure also represents the physically viable conditions, such as in the healthy (unstenosed) model, the relative pressure in different locations of the model are uniform. The one and two stenoses models refers the pressure differences are very distinguishable between the upstream and downstream flow of the lesion areas [30]. For the arterial bifurcation with angle 95° and angle 75°, we measure the FFR and stenosis percentage that is obtained from the simulation results and the results are shown in Table 2.
From Tables 1 and 2, we can see the hemodynamic results for the bifurcation angles, 93° and 75°. The FFR value is calculated from the ratio of the downstream and upstream relative pressure of the stenosis model and the percentage of stenosis is calculated from equation (2) [32].
Percentage of stenosis = [1- (D stenosis ÷ D normal)] X 100% (2)
For the arterial bifurcation with the larger angle 93°, we can see from Table 2 that the measured FFR for the one stenosis model is 0.71, which is less than 0.80 and the stenosis percentage is 29%. So, it is not a severe problem. Again, from Table 2 we see that measured FFR for the two stenoses model is 0.40, which is also 0.80 and the stenosis percentage is 60%, which is certainly a very severe problem. For the arterial bifurcation with the smaller angle 75°, we can see from the table that the measured FFR for the one stenosis model is 0.80, which is 0.80 and the stenosis percentage is 20%. It also does not depict a severe problem. Further, from the table we can see that the measured FFR for the two stenoses model is 0.66, which is also less than 0.80 and the stenosis percentage is 34%. So, this depicts a severe problem.
Hence, we made a comparison between models of two different bifurcation angles using numerical simulation based on velocity magnitudes and pressure gradient. The simulated values indicate how the angles affect hemodynamics of bifurcated coronary arteries. Certainly we can observe that the severity of stenosis differ for different angles and stenosis in the various models.
For the arterial bifurcation with larger angle 93° the severity of stenosis is much higher than the severity of stenosis for the smaller angle 75° for the two stenoses model. The observed results prove that the bifurcation angle has an effect on the pressure gradient as well as velocity magnitudes when a stenosis exists in the model. From the simulation result we also analyze geometrical variations, such as degrees of arterial occlusions at the proximal sections of the bifurcated arteries, curvature of the arteries and the combined effect of these geometrical variations. This can provide a clearer insight in how irregular geometries of the coronary arteries can affect coronary blood flow. Thus we suggest that the performed blood flow simulations in different physiological conditions provide feasible results in the idealized 3D models.
CONCLUSION
The purpose of this study was to noninvasively assess hemodynamic parameters with CFD in coronary atherosclerosis for idealized coronary artery model from patient-specific computed tomography angiography data. The hemodynamic parameters allow to describe the intrinsic blood flow patterns. This has been accomplished with the development of a set of techniques which includes idealized model reconstruction, analyze and discretize 3D model from computer-aided design model and numerical simulation.
Computational hemodynamics that relies on a numerical simulation framework has been implemented to verify the effect of bifurcation angles of stenosis in coronary blood flow using idealized coronary artery model. For achieving this we first construct the geometry of the idealized model imitating patient specific coronary artery data using FreeCAD software. Since the geometry of the 3D model has uniform shape the finite element method is used to produce computational meshes, so that it can provide a concise and comprehensive solution over curved surfaces and 3D volume cells. CFD solver is employed for generating the hemodynamic parameters (velocity magnitude, pressure gradient). We calculate the severity of stenosis from FFR which is measured as the ratio of downstream and upstream pressure. The simulation results are compared with the clinical data. We obtain the following findings: Both Figures 10 and 11 show that, due to the stenosis in the main LAD artery, the blood flow is much higher in the stenosis region than other locations in the 3D model.
The pressure difference and FFR results allow to distinguish between healthy (unstenosed) and diseased (stenosed) models with arterial bifurcation of two different angles 93° and 75°.
From the FFR values it is observed that the severity of stenosis is much higher in the two stenoses model with arterial bifurcation of angle 93° and 75°. So, the bifurcation angle with the existence of a stenosis has significant impact on the hemodynamic parameters of the idealized model.
The techniques developed and presented in this study are very promising for the future. If it is possible to reduce the limitations of this work, then this non-invasive method might replace the expensive and invasive diagnosis test catheterization for evaluating FFR in coronary arteries. Utilizations of hemodynamic indicators, such as blood velocity, pressure difference, FFR value can give a clear insight of blood circulation in the human body. Hence, the combined application of CFD with CCTA procedure is not only saving direct health-care costs but also could reduce indirect costs and patient risks, such as heart attack, stroke and death. So, this procedure can provide medical experts support in diagnosing cardiovascular disease and for better treatments of diseased arteries.
1. Asakura T, Karino T (1990) Flow patterns and spatial distribution of atherosclerotic lesions in human coronary arteries. Circ Res 66: 1045-1066.
2. Nosovitsky VA, Ilegbusi OJ, Jiang J, Stone PH, Feldman CL (1997) Effects of curvature and stenosis-like narrowing on WSS in a coronary artery model with phasic flow. Comput Biomed Res 30: 61-82.
3. Perktold K, Peter RO, Resch M, Langs G (1991) Pulsatile non-Newtonian blood flow in three-dimensional carotid bifurcation models: A numerical study of flow phenomena, under different bifurcation angles. J Biomed Eng 13: 507-515.
4. Zhang B, Jin Y, Wang X, Zeng T, Wang L (2017) Numerical simulation of transient blood flow through the left coronary artery with varying degrees of bifurcation angles. J Mech Med Biol 17: 1750005.
5. Heitzer T, Schlinzig T, Krohn K, Meinertz T, Mu ̈nzel T (2001) Endothelial dysfunction, oxidative stress and risk of cardiovascular events in patients with coronary artery disease. Circulation 104: 2673-2678.
6. Meijboom WB, Van Mieghem CAG, van Pelt N, Weustink A, Pugliese F, et al. (2008) Comprehensive assessment of coronary artery stenosis: Computed tomography coronary angiography versus conventional coronary angiography and correlation with fractional flow reserve in patients with stable angina. J Amer College of Cardiology 52: 636-643.
7. Zhang J, Zhong L, Luo T, Huo Y, Tan SY, et al. (2014) Numerical simulation and clinical implications of stenosis in coronary blood flow. BioMed Research International 2014: 514729.
8. Eslami P, Seo J, Rahsepar AA, George R, Lardo AC, et al. (2015) Computational study of computed tomography contrast gradients in models of stenosed coronary arteries. J Biomech Eng 137.
9. Sadatomo T, Yuki K, Migita K, Imada Y, Kuwabara M, et al. (2013) Difference between middle cerebral artery bifurcations with normal anatomy and those with aneurysms. Neurosurg Rev 36: 437-445.
10. Zarins CK, Giddens DP, Bharadvaj BK, Sottiurai VS, Mabon, et al. (1983) Carotid bifurcation atherosclerosis, Quantitative correlation of plaque localization with flow velocity profiles and wall shear stress. Circ Res 53: 502-514.
11. Lehoux S (2006) Redox signaling in vascular responses to shear and stretch. Cardiovasc Res 71: 269-279.
12. Chaichana T, Sun Z, Jewkes J (2011) Computation of hemodynamics in the left coronary artery with variable angulations. J Biomech 44: 1869-1878.
13. Weddell JC, Kwack JH, Imoukhuede PI, Masud A (2015) Hemodynamic analysis in an idealized artery tree: Differences in wall shear stress between Newtonian and non-Newtonin blood models. PLoS ONE 10: e0124575.
14. Han Hc (2012) Twisted blood vessels: Symptoms, etiology and biomechanical mechanisms. J Vasc Res 49: 185-197.
15. Li Y, Shen C, Ji Y, Feng Y, Ma G, et al. (2011) Clinical implication of coronary tortuosity in patients with coronary artery disease. PLoS One 6: e24232.
16. Zegers ES, Meursing BT, Zegers EB, Ophuis AJ (2007) Coronary tortuosity: A long and winding road. Neth Heart J 15: 191-195.
17. Turgut O, Yilmaz A, Yalta K, Yilmaz BM, Ozyol A, et al. (2007) Tortuosity of coronary arteries: An indicator for impaired left ventricular relaxation. Int J Cardiovasc Imaging 23: 671-677.
18. Gaibazzi N, Rigo F, Reverberi C (2011) Severe coronary tortuosity or myocardial bridging in patients with chest pain, normal coronary arteries and reversible myocardial perfusion defects. Am J Cardiol 108: 973-978.
19. Li Y, Liu N, Gu Z, Chen Y, Lu J, et al. (2012) Coronary tortuosity is associated with reversible myocardial perfusion defects in patients without coronary artery disease. Chin Med J 125: 3581-3583.
20. Xie X, Wang Y, Zhu H, Zhou H, Zhou J (2013) Impact of coronary tortuosity on coronary blood supply: A patient-specific study. PLoS ONE 8: e64564.
21. World Health Organisation (2002) The World Health Report 2002: Reducing risks, promoting healthy life. Geneva: World Health Organization.
22. Tobias P, Curtiss LK (2005) Thematic review series: The immune system and atherogenesis. Paying the price for pathogen protection: Toll receptors in atherogenesis. J Lipid Research 46: 404-411.
23. Hansson GK (2005) Inflammation, atherosclerosis, and coronary artery disease. N Eng J Med 352: 1685-1695.
24. Greaves DR, Gordon S (2005) Thematic review series: The immune system and atherogenesis. Recent insights into the biology of macrophage scavenger receptors. J Lipid Research 46: 11-20.
25. Libby P (2002) Inflammation in atherosclerosis. Nature 420: 868-874.
26. Caro CG, Fitz-Gerald JM, Schroter RC (1969) Arterial wall shear and distribution of early atheroma in man. Nature 223: 1159-1160.
27. Friedman MH, Hutchins GM, Bargeron CB, Deters OJ, Mark FF (1981) Correlation between intimal thickness and fluid shear in human arteries. Atherosclerosis 39: 425-436.
28. Sun Z, Xu L (2014) Computational fluid dynamics in coronary artery disease. CMIG 38: 651-663.
29. Ku DN (1997) Blood flow in arteries. Annu Rev Fluid Mech 29: 399-434.
30. Hoque KE, Sawall S, Hoque MA, MS Hossain (2018) Hemodynamic simulations to identify irregularities in coronary artery models. JAMCS 28: 1-19.
31. Chen X, Luo B, Yang R, Chen L (2007) A clinical study on coronary artery blood velocity measured by digital tracing coronary angiography. J Pub Med 24: 294-298.
32. Schwartz J (2011) Calculating percent stenosis. Am J Neuroradiol 22: 228.
-
 Table 1
 -
Table 2
QUICK LINKS
- SUBMIT MANUSCRIPT
- RECOMMEND THE JOURNAL
-
SUBSCRIBE FOR ALERTS
RELATED JOURNALS
- Journal of Allergy Research (ISSN:2642-326X)
- Journal of Psychiatry and Psychology Research (ISSN:2640-6136)
- Archive of Obstetrics Gynecology and Reproductive Medicine (ISSN:2640-2297)
- Journal of Otolaryngology and Neurotology Research(ISSN:2641-6956)
- Journal of Cancer Science and Treatment (ISSN:2641-7472)
- Chemotherapy Research Journal (ISSN:2642-0236)
- International Journal of Internal Medicine and Geriatrics (ISSN: 2689-7687)