858
Views & Citations10
Likes & Shares
The quality and
assessment of a reservoir can be documented in details by the application of
Seismo magnetic field. This research aims to calculate fractal dimension from
the relationship among Seismo magnetic field, maximum Seismo magnetic field and
wetting phase saturation and to approve it by the fractal dimension derived
from the relationship among capillary pressure and wetting phase saturation. In
this research, porosity was measured on real collected sandstone samples and
permeability was calculated theoretically from capillary pressure profile measured
by mercury intrusion contaminating the pores of sandstone samples in
consideration. Two equations for calculating the fractal dimensions have been
employed. The first one describes the functional relationship between wetting
phase saturation, Seismo magnetic field, maximum Seismo magnetic field and
fractal dimension. The second equation implies to the wetting phase saturation
as a function of capillary pressure and the fractal dimension. Two procedures
for obtaining the fractal dimension have been utilized. The first procedure was
done by plotting the logarithm of the ratio between Seismo magnetic field and
maximum Seismo magnetic field versus logarithm wetting phase saturation. The
slope of the first procedure=3 - Df (fractal dimension). The second procedure
for obtaining the fractal dimension was determined by plotting the logarithm of
capillary pressure versus the logarithm of wetting phase saturation. The slope
of the second procedure=Df - 3. On the basis of the obtained results of the
fabricated stratigraphic column and the attained values of the fractal
dimension, the sandstones of the Shajara reservoirs of the Shajara Formation
were divided here into three units. The obtained units from bottom to top are:
Lower, Middle and Upper Shajara Seismo magnetic field Fractal Dimension Units.
It was found that fractal dimension increases with increasing grain size and
permeability.
INTRODUCTION
MATERIALS AND METHOD
Sw= [Hs,r1/2/H1/2S,r,max][3-Df] (1)
Where Sw
the water saturation, H the seismo magnetic field in ampere/meter generated
from the shear wave velocity, Hmax the maximum seismo magnetic field
in ampere/meter generated from the shear wave velocity and Df the fractal
dimension.
“Eq. (1)”
can be proofed from:
HS, ϴ= [Ф * kf * ζ * ρf √G/ρ * dUS,r/dt / α∞ * η] (2)
Where HS,ϴ
the seismo magnetic field generated from shear wave velocity in ampere/meter, Φ
the porosity, ε0 permittivity of free scape in Faraday/meter, kf dielectric
constant of the fluid, ζ the zeta potential in volt, ρf the fluid density in
kilogram/meter, G the shear modulus in pascal, ρ bulk density in kilogram/m3,
dUS,r/dt the radial grain velocity in meter/second, α∞
the tortuosity and η the fluid viscosity in pascal * second.
The zeta potential can be scaled as:
ζ = [Cs * σf * η/ εf] (3)
Where ζ the
zeta potential in volt, CS streaming potential coefficient in volt/pascal, σf
the fluid electric conductivity in Siemens/meter, η the fluid viscosity in
pascal * second, εf the fluid permittivity in Faraday/meter.
Insert “Eq.
(3)” in “Eq. (2)”:
HS, ϴ= [Ф * ε0 * kf * Cs * σf * η * ρf √G/ρ * dUS,r/dt / α∞ εf * η] (4)
The
streaming potential coefficient can be scaled as:
CS = [reff2 * CE/ 8 * σf * η] (5)
Where CS
the streaming potential coefficient in volt/pascal, reff the
effective pore radius in meter, CE the electro osmosis coefficient in
pascal/volt, σf the fluid conductivity in Siemens/meter and η the fluid
viscosity in pascal * second.
Insert “Eq. (5)” into “Eq. (4)”:
HS, ϴ= [Ф * ε0 * kf * reff2 * CE σf
* η * ρf √G/ρ * dUS,r/dt
/ α∞ εf * η * 8 * σf * η] (6)
If the pore
radius is introduced equation 6 will become,
HS,
ϴ= [Ф * ε0 * kf * r2
* CE * σf * η
* ρf √G/ρ * dUS,r/dt / α∞ εf *
η * 8 * σf * η] (7)
The maximum
pore radius can be scaled as:
HS,r,max
= [Ф * ε0 * kf * r2max
* CE * σf * η
* ρf √G/ρ * dUS,r/dt / α∞ εf *
η * 8 * σf * η] (8)
Divide “Eq.
(7)” by “Eq. (8)”:
[HS,
ϴ / HS,r,max ] = [ [Ф * ε0 * kf * r2 * CE * σf * η * ρf √G/ρ * dUS,r/dt / α∞
εf * η * 8 * σf * η] / [Ф * ε0 * kf * r2max
* CE * σf * η
* ρf √G/ρ * dUS,r/dt / α∞ εf *
η * 8 * σf * η] ]
(9)
“Eq. (9)”
after simplification will become,
[HS,
ϴ / HS,r,max ] = [r2
/ r2max] (10)
Take the
square root of “Eq. (10)”:
√
[HS, ϴ / HS,r,max ] = √ [r2
/ r2max ] (11)
“Eq. (11)”
after simplification will become,
[HS, ϴ1/2 / HS,r,max 1/2] = [r / rmax] (12)
Take the
logarithm of “Eq. (12)”:
log [HS, ϴ1/2 / HS,r,max 1/2] = [r / rmax] (13)
But; log [r / rmax] = log Sw / [3-Df] (14)
Insert “Eq.
(14)” into “Eq. (13)”:
log Sw / [3-Df] = log [HS, ϴ1/2
/ HS,r,max 1/2] (15)
After log
removal “Eq. (15)”" will become,
Sw = [HS,
ϴ1/2 / HS,r,max 1/2] [3-Df] (16)
“Eq. (16)”
the proof of equation 1 which relates the water saturation, seismo magnetic
field, maximum seismo magnetic field generated from the shear wave and the
fractal dimension.
The
capillary pressure can be scaled as:
Sw = [Df -3 ] * Pc * constant (17)
Where Sw
the water saturation, Pc the capillary pressure and Df the fractal dimension.
RESULTS AND DISCUSSION
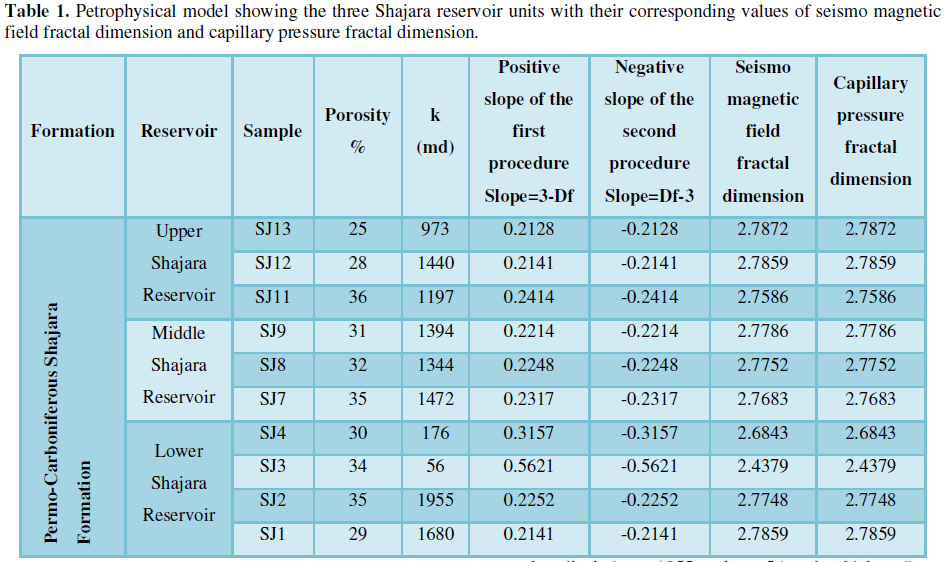
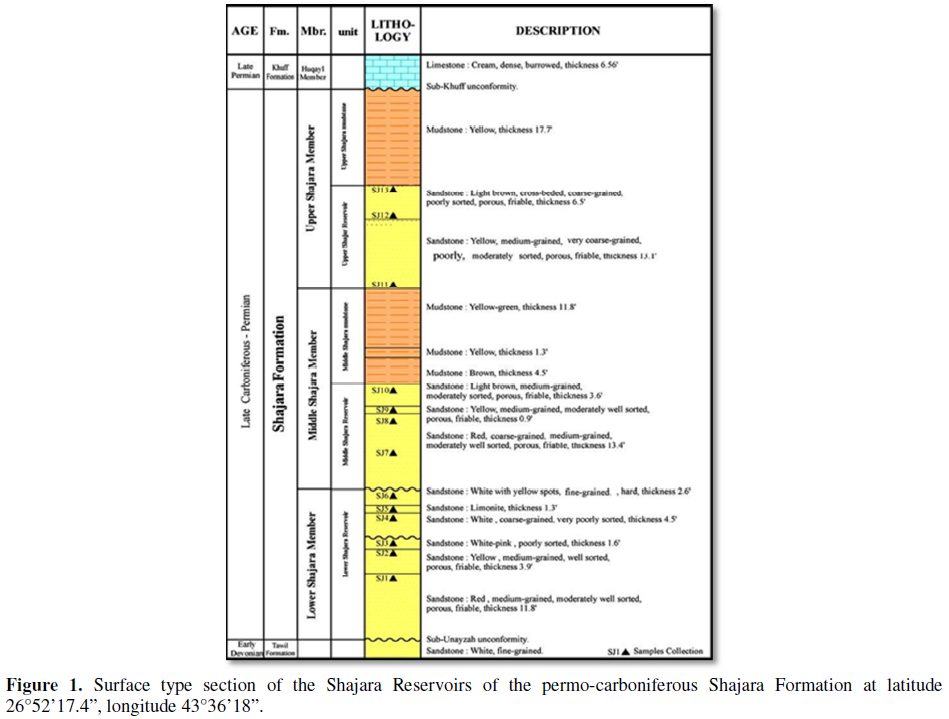
Based on
field observation the Shajara Reservoirs of the Permo-Carboniferous Shajara
Formation were divided here into three units as described in Figure 1. These units from bottom to
top are: Lower Shajara Reservoir, Middle Shajara reservoir and Upper Shajara
Reservoir. Their acquired results of the seismo magnetic field fractal
dimension and capillary pressure fractal dimension are displayed in Table 1. Based on the attained results
it was found that the seismo magnetic field fractal dimension is equal to the
capillary pressure fractal dimension. The maximum value of the fractal
dimension was found to be 2.7872 assigned to sample SJ13 from the Upper Shajara
Reservoir as verified in Table 1.
Whereas the minimum value of the fractal dimension 2.4379 was reported from
sample SJ3 from the Lower Shajara reservoir as displayed in Table 1. The seismo magnetic field
fractal dimension and capillary pressure fractal dimension were observed to
increase with increasing permeability as proofed in Table 1 owing to the possibility of having interconnected channels.
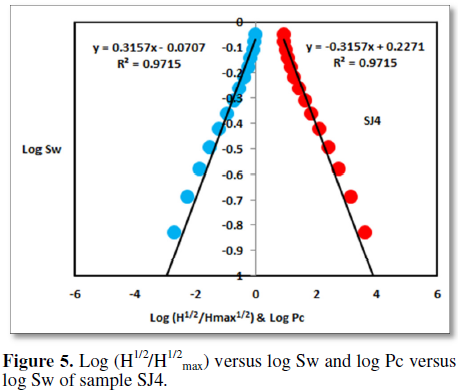
The
Lower Shajara reservoir was denoted by six sandstone samples (Figure 1), four of which label as SJ1,
SJ2, SJ3 and SJ4 were carefully chosen for capillary pressure measurement as
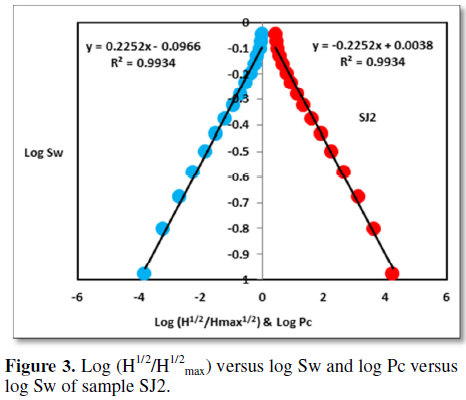
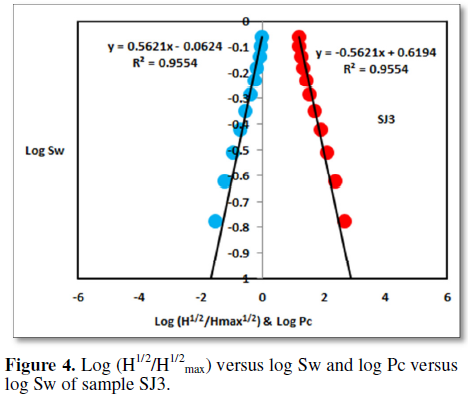
established in Table 1. Their
positive slopes of the first procedure log of the seismo magnetic field (H) to
maximum seismo magnetic field (Hmax) versus log wetting phase
saturation (Sw) and negative slopes of the second procedure log capillary
pressure (Pc) versus log wetting phase saturation (Sw) are explained in Figures 2-5 and Table 1. Their seismo
magnetic field fractal dimension and capillary pressure fractal dimension
values are revealed in Table 1. As
we proceed from sample SJ2 to SJ3 a pronounced reduction in permeability due to
compaction was described from 1955 md to 56 md which reflects decrease in
seismo magnetic field fractal dimension from 2.7748 to 2.4379 as quantified in Table 1. Again, an increase in grain
size and permeability was proved from sample SJ4 whose seismo magnetic field
fractal dimension and capillary pressure fractal dimension was found to be
2.6843 as pronounced in Table 1.
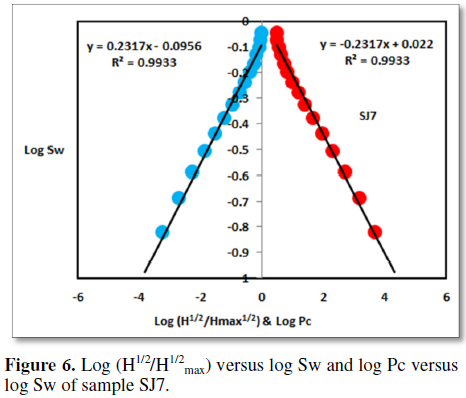
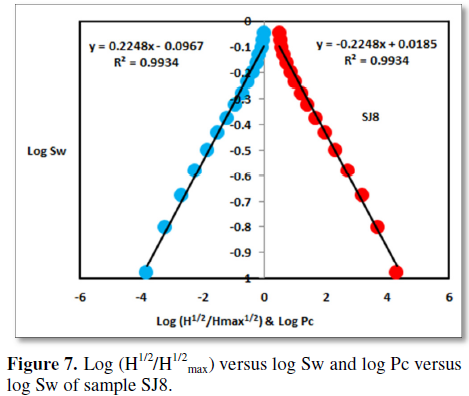
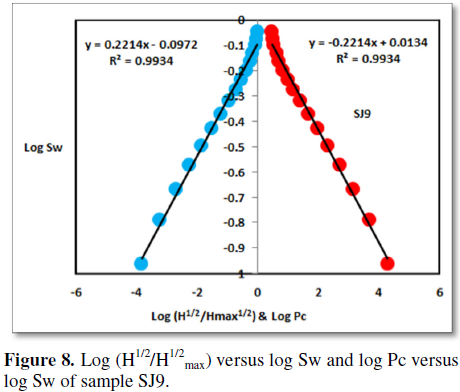
In
contrast, the Middle Shajara reservoir which is separated from the Lower
Shajara reservoir by an unconformity surface as shown in Figure 1. It was nominated by four samples (Figure 1), three of which named as SJ7, SJ8 and SJ9 as clarified
in Table 1 were chosen for capillary
measurements as described in Table 1.
Their positive slopes of the first procedure and negative slopes of the second
procedure are shown in Figures 6-8 and
Table 1. Furthermore, their seismo magnetic field fractal dimensions and
capillary pressure fractal dimensions show similarities as defined in Table 1. Their fractal dimensions are
higher than those of samples SJ3 and SJ4 from the Lower Shajara Reservoir due
to an increase in their permeability as explained in Table 1.
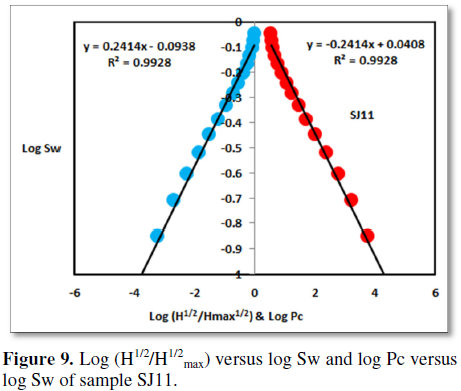
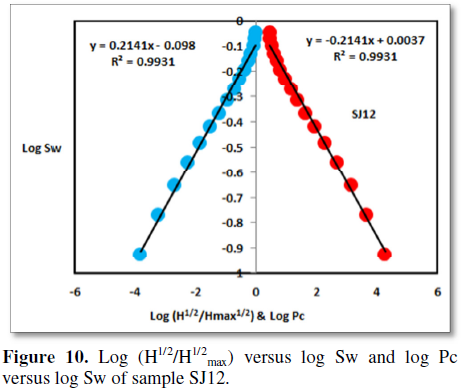
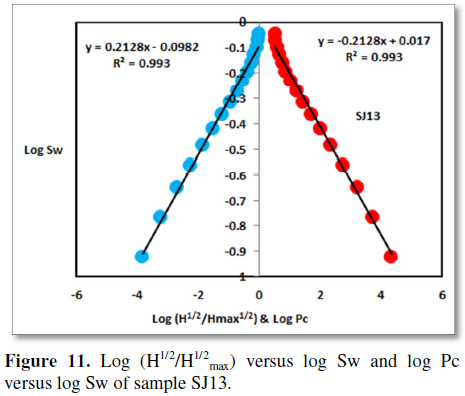
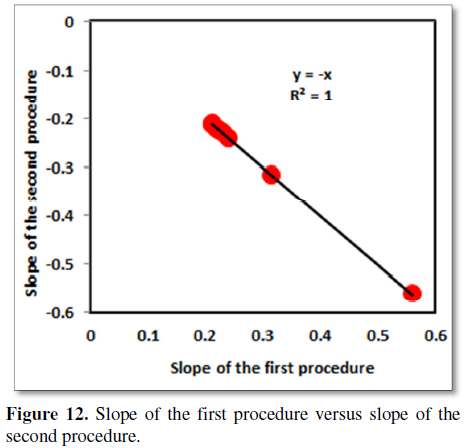
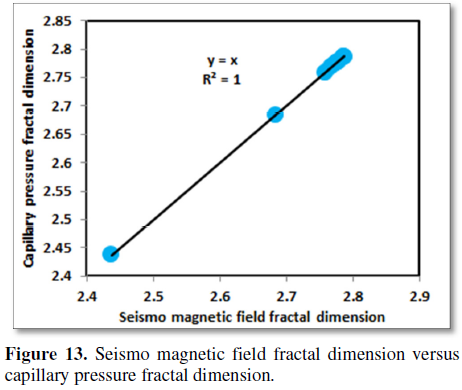
On the other hand, the Upper Shajara reservoir was separated from the Middle Shajara reservoir by yellow green mudstone as shown in Figure 1. It is defined by three samples so called SJ11, SJ12, SJ13 as explained in Table 1. Their positive slopes of the first procedure and negative slopes of the second procedure are displayed in Figures 9-11 and Table 1. Moreover, their seismo magnetic field fractal dimension and capillary pressure fractal dimension are also higher than those of sample SJ3 and SJ4 from the Lower Shajara Reservoir due to an increase in their permeability as simplified in Table 1. Overall a plot of positive slope of the first procedure versus negative slope of the second procedure as described in Figure 12 reveals three permeable zones of varying Petrophysical properties. These reservoir zones were also confirmed by plotting seismo magnetic field fractal dimension versus capillary pressure fractal dimension as described in Figure 13. Such variation in fractal dimension can account for heterogeneity which is a key parameter in reservoir quality assessment.
CONCLUSION
•
The sandstones of the Shajara Reservoirs
of the Shajara formation permo-carboniferous were divided here into three units
based on seismo magnetic field fractal dimension.
•
The Units from base to top are: Lower
Shajara seismo magnetic field Fractal dimension Unit, Middle Shajara Seismo
Magnetic Field Fractal Dimension Unit and Upper Shajara Seismo Magnetic Field
Fractal Dimension Unit.
•
These units were also proved by
capillary pressure fractal dimension.
•
The fractal dimension was found to
increase with increasing grain size and permeability owing to possibility of
having interconnected channels.
ACKNOWLEDGEMENT
1.
Frenkel J (1944) On the theory of seismic and
seismoelectric phenomena in a moist soil. J Phys 3: 230-241.
2.
Li K, Williams W (2007) Determination of capillary
pressure function from resistivity data. Transport in Porous Media 67: 1-15.
3.
Revil A, Jardani A (2010) Seismoelectric response of
heavy oil reservoirs: theory and numerical modelling. Geophys J Int 180:
781-797.
4.
Dukhin A, Goetz P, Thommes M (2010) Seismoelectric
effect: A non-isochoric streaming current. experiment. J Colloid Interface Sci
345: 547-553.
5.
Guan W, Hu H, Wang Z (2012) Permeability inversion from
low-frequency seismoelectric logs in fluid saturated porous formations. Geophys
Prospect 61: 120-133.
6.
Hu H, Guan W, Zhao W (2012) Theoretical studies of
permeability inversion from seismoelectric logs. Geophysical Research
Abstracts. 14: EGU2012-6725-1, 2012 EGU General Assembly 2012.
7.
Borde C, S´en´echal P, Barri`ere J, Brito D, Normandin E,
et al. (2015) Impact of water saturation on seismoelectric transfer functions:
a laboratory study of co-seismic phenomenon. Geophys J Int 200: 1317-1335.
8.
Jardani A, Revil A (2015) Seismoelectric couplings in a
poroelastic material containing two immiscible fluid phases. Geophys J Int 202:
850-870.
9.
Holzhauer J, D Brito, C Bordes, Y Brun, B Guatarbes
(2016) Experimental quantification of the seismoelectric transfer function and
its dependence on conductivity and saturation in loose sand. Geophys Prospect
65: 1097-1120.
10.
Rong P, W Xing, D Rang, D Bo, L Chun (2016) Experimental
research on seismoelectric effects in sandstone. Appl Geophys 13: 425-436.
11.
Djuraev U, Jufar S, Vasant P (2017) Numerical Study of
frequency-dependent seismoelectric coupling in partially-saturated porous
media. MATEC Web of Conferences 87: 02001.
12.
Alkhidir KEME (2017) Pressure head fractal dimension for
characterizing Shajara reservoirs of the Shajara formation of the
permo-carboniferous Unayzah group, Saudi Arabia. Arch Pet Environ Biotechnol
2017: 1-7.
13.
Al-Khidir KE (2018) On similarity of pressure head and
bubble pressure fractal dimensions for characterizing permo-carboniferous
Shajara formation, Saudi Arabia. J Indust Pollut Toxic 1: 1-10.
14.
Alkhidir KEME (2018) Geometric relaxation time of induced
polarization fractal dimension for characterizing Shajara reservoirs of the
Shajara formation of the permo-carboniferous Unayzah group, Saudi Arabia.
Scifed J Petroleum 2: 1-6.
15.
Alkhidir KEME (2018) Geometric relaxation time of induced
polarization fractal dimension for characterizing Shajara reservoirs of the
Shajara formation of the permo-carboniferous Unayzah group-Permo. Int J
Petroleum Res 2: 105-108.
16.
Alkhidir KEME (2018) Arithmetic relaxation time of
induced polarization fractal dimension for characterizing Shajara reservoirs of
the Shajara formation. Nanosci Nanotechnol 1: 1-8.
17.
AlKhidir KEME (2018) Seismo electric field fractal
dimension for characterizing Shajara reservoirs of the permo-carboniferous
Shajara formation, Saudi Arabia. Petroleum Chem Eng J 2: 1-8.
18.
Alkhidir KEME (2018) Resistivity fractal dimension for
characterizing Shajara reservoirs of the permo-carboniferous Shajara formation
Saudi Arabia. Int J Petrochem Sci Eng 3: 109-112.
19.
Alkhidir KEME (2018) Electro kinetic fractal dimension
for characterizing Shajara reservoirs of the Shajara formation. Int J
Nanotechnol Med Eng 3: 1-7.
20.
Alkhidir KEME (2018) Electric Potential energy fractal
dimension for characterizing permo-carboniferous Shajara formation. Expert Opin
Environ Biol 7: 1-5.
21.
Alkhidir KEME (2018) Electric potential gradient fractal
dimension for characterizing Shajara Reservoirs of the permo-carboniferous
Shajara formation, Saudi Arabia. Arch Petro Chem Eng 2018: 1-6.
22.
Alkhidir KEME (2018) On similarity of differential
capacity and capillary pressure fractal dimensions for characterizing Shajara
reservoirs of the permo-carboniferous Shajara formation, Saudi Arabia. SF J
Biofuel Bioenerg 1: 1-10.
-
 Table 1