689
Views & Citations10
Likes & Shares
The current review paper illustrated the
invention in estimation of Fluorspar method; it is commonly used for slag
making in steel industry, glass manufacturing and high purity acid grade in
nuclear process. In the last centuries significant research efforts have been
done for the analysis of fluorspar on industrial basis but still CaF2
has been analyzed by classical method and no quick method is available.
Fluorspar mainly consists of SiO2, CaO, Al2O3,
BaO and CaF2. At present, we have developed X-ray fluorescence
method and in current review we emphasize and compare the mineralogical
contents of fluorspar estimated by conventional method and new advance method.
Keywords: CaF2, WDXRF method Conventional method, CS analyzer
INTRODUCTION
History and etymology
Fluorite is Latin word noun, fluo, means continuous
with flow like water flow. In verb present as fluor or fluere, is stated as
flow. The CaF2 is utilized as flux in steel making process to
increase the fluidity of slag or we can say decrease the viscosity. Calcium
fluoride melts at 1676 K. The word flux extracted from Latin word noun fluxes.
German scientist Agricola having expertise in philology, mining and metallurgy
termed as fluorspar as Neo Latinization of the German Flussespar from Flusse
(stream, river) and “Spar” (meaning a nonmetallic mineral akin to gypsum,
spærstān, spear stone, belong to name crystalline (Picture 1) [1,2].
Fluorite is called as fluorspar is a halide consists
of CaF2. Calcium fluoride is an isometric mineral with a cubic
structure with octahedral and other complex isometric shapes are not
occasional. CaF2 is a colorful mineral having with visible
ultraviolet light and it is used as ornamental and lapidary. Fluorite is
commonly used in industry as a source of flux for smelting, glasses production
and enamels. High quality CaF2 grades are used a source of fluoride
for HF acid manufacturing. It is also used source as intermediate fluorine
containing fine chemicals. By using fluorite prepared low dispersion lenses for
far ultraviolet region mostly used in microscope and telescopes.
Calcium fluoride inorganic compound consist of
calcium and fluorine having formula CaF2 and F-centrally coordinated
with 04 Ca2+ centers [4]. Crystalline samples of CaF2 are
mostly colorless and some are deep color due to F- presence in center. The few
crystal presence in numerous ionic compounds with CeO2, ZrO2,
etc.
Occurrence
Fluorite is broadly presence
mineral in huge deposits in much area. Significant occurrence areas in China,
Germany, Austria, Switzerland, England, Norway, Mexico and both the Province of
Ontario and Newfoundland and Labrador in Canada. Large deposits also occur in
Kenya in the Kerio Valley area within the Great Rift Valley. In Pakistan, Fluorspar
is majorly present in Loralai, etc.
APPLICATION, SOURCE OF FLUORINE
AND FLUORIDE
High purity grade is manufactured by combination with calcium carbonate and hydrofluoric acid [5].
CaCO3 + 2 HF → CaF2 + CO2 +
H2O
Fluorite is a main source of
hydrogen fluoride [6]; it is commonly used for the production of wide range of
materials. HF is evaluated from mineral by the reaction with concentrated
sulfuric acid.
CaF2(s) + H2SO4 → CaSO4(s)
+ 2 HF (g)
The produced HF is converted into fluoride, fluorocarbons and produced different materials. In 1990s annually production of CaF2 is five billion kilogram. There are three main type of natural fluorspar used in industries. Metallurgical grade fluorite (60-85% CaF2), Ceramic grade fluorite (85-95% CaF2) and highest grade, “acid grade fluorite” (97% or more CaF2), accounts for about 95%.
Metallurgical grade has been
used traditional as flux; ceramic grade is used in the manufacturing of glass,
enamels and cooking utensils. Acid grade used to make hydrogen fluoride and
hydrofluoric acid and traditionally by reaction with fluorite with H2SO4
[7,8].
ESTIMATION OF FLUORSPAR BY
DIFFERENT SCIENTIST
Calcium fluoride contents
were determined by EDTA in iron tailings. The samples were prepared by diluted
acetic acid to leach calcium carbonate. The contents of CaF2 consist
of two parts one fluoride contents were illustrated by zirconium xylenol orange
by spectrometer after CaF2 was filtered according to these values
concentration of CaF2 were calculated and other practice of CaF2
by leaching as precipitating with leaching aluminum chloride solution for
titration calcium indicator used as indicator EDTA standard titration solution
was used to determine for precipitation of CaF2 in KOH medium.
Therefore CaF2 contents were calculated by values. This illustrated
method was simple, rapid, précised and recovery could meet the requirements in
the CaF2 determination the standard deviation was less than 1% and
recovery 99-101% [9].
The invented method is for
the quantitative determination of calcium fluoride by EDTA titration. Take
0.2-0.50 g sample material into beaker then added HCl and boric acid solution
heat and dissolved for 20-40 min filter sample and collecting filtrate wash
precipitates present beaker cool and added water. If barium is present in
sample <0.2 wt%, it is precipitating out taking out 10-20% filtrate in
beaker with 80-100 ml water and used triethanolamine with KOH to maintained pH
grater then 13 and titrate with EDTA standard solution in the presence of mixed
indicator. In case of barium grater then >0.2 wt%, aliquot 10-20% of
filtrate in beaker adding 40-50 ml introduce 2-5 drops sulfuric acid and boil
10-20 min and hold grater then 8 h and collect filtrate in another beaker
washing the original beaker ppt and maintained filtrate volume 80-120 ml and
add tri-ethanolamine maintained pH by using KOH gratering grater then 13,
titrate with EDTA with mixed indicator.
In first step weight
0.20-0.30 g and 0.40-1.20 g samples material in two beakers then add HCl-H2SO4
solution hold at room temperature for 40-60 min and shake 3-50 min till ppt
fully dispersed, 1-3 drop phenolphaline indicator and adding KOH the reddish
color this process continue till HCL reddish color disappears, transfer
solution in volumetric flask and fill with water and hold for 8 h then pipette
out 30-50% and repeat same procedure after end of titration calculate non
calcium fluoride calcium content in sample by using two volume difference and
weight difference of sample materials. The mixed indicter is mixture of calcium,
European Pharmacopoeia Reagent and potassium chloride. The invented method has
precise and CaF2 calculated values are authentication.
Fluorite powder directly
analyzed by XRF after pressed pellet combination with spectroscopy, the total
content of Ca and content of Fe2O3, P, SiO2
and K2O as well as carbon present in sample analyzed by IR
absorption spectrometer and carbon content calculated as CaCO3 then
CaF2 calculated content in fluorite. For estimation of unknown
samples the working curve was made using nine certified reference material the
method is accurate and further verification an accuracy standard (GBW07254) was
used to test accuracy and precision of method and found results satisfactory
[10].
Analysis of fluorspar by
traditional method after separating calcium carbonate and calcium fluoride it
takes longer time and not suitable for production but accuracy of results from
this method is very high. The publisher was illustrated two methods, alkali
fusion and acid leaching method. The operation analyzing results of this method
was very easy and short time for completion of analysis and observed that
results were accurate and it could be used for quick analyzing before
production.
The fluorite standards
prepared in group and samples with binder formed in the form of pressed pellets
method. These press pellets analyzed by x-ray fluorescence spectrometer and
obtained liner regression line. Curves after deduction of enhanced absorption
and spectral line overlap interference determine the content of pressed pellet
by using curve and calculate the fluorite by analysis of the corresponding
relation of spectral line intensity and concentration. The standards samples
and binder after sieving 300 mesh formed press pellet by using palletizer. This
creative method is rapid and accurate and can reduce the estimation cost and
enhance the detection limits. [11].
Other method for estimation
of calcium fluorite as CaC2 with diluted acetic acid. CaF2
cannot dissolved in acetic acid therefore sample was treated with acetic acid
and insoluble material filtered by filter paper then introduced potash solution
till pH attain 13 or greater than 13. CaC2 was determined by EDTA
titration method. Insoluble filtered material and filter paper was burned in
platinum crucible and added mixed flux with boric acid melt at 950°C than
acidify and added potash solution till pH 13 or greater and analyze CaF2
with EDTA titration. The RSD value of CaC2 was 0.064 and 0.01916%
and CaF2 RSD value observed 0.6285 and 0.8357%.
Fluorspar contents like CaF2,
SiO2, Al2O3 and total iron (TFe) are
calculated by XRFS. The samples were prepared by 1 g of sample and fusion
mixture KNO3 (0.2 g), Li2CO3 (1.0 g) and Li2B4O7
(5.0 g) in a Pt crucible and after addition of 3 drops of 150 g/L-1
LiBr solution, the mixture was fused at 1050° for 20 min. after cooling the 4
components were estimated. Samples present with reductive substance the fusion
method should be modified. Li2B4O7 put in the platinum
crucible after melting coated on inner wall of crucible at lower and bottom
side. After cooling, KNO3 and Li2CO3 added to
the crucible and peroxide at low temperature and fused sample as same
procedure. The melt sample was used for detection of 4 components. Working
curve prepared and used for estimation of results. Four samples were analyzed
by said method and giving results has consistency with results [12].
Review on new published paper
“Quantification of Metallurgical Flux by Wavelength Dispersive X-ray
Fluorescence” this advance test method was developed for the quantification of
fluorspar (CaF2) along with other present ingredients especially
trace elements like Ba, Sr, P and Mg. All above reported abstract showed that
few methods are invented in which analysis of fluorspar has carried out
partially and did not emphasize on complete chemistry of fluorspar. It can only
analyze Si, P, K, Na and other elements Ca soluble and total were analyzed by
classical methods.
The current established
method can analyze necessary elements by WDXEF and carbon was analyzed by
carbon sulphur analyzer as well as presence of CO2 as CaCO3
was confirmed by using ATR-FTIR and XRD method.
EXPERIMENTAL
Estimation of minerals XRF
WD-XRF- Philips Axios Max,
3KW Rhodium tube as X-ray generator along with crystals, channels and
collimator mask was used for creation of application and analyze standards and
unknown samples. Carbon was analyzed by CS-800 (Eltra) analyzer [12].
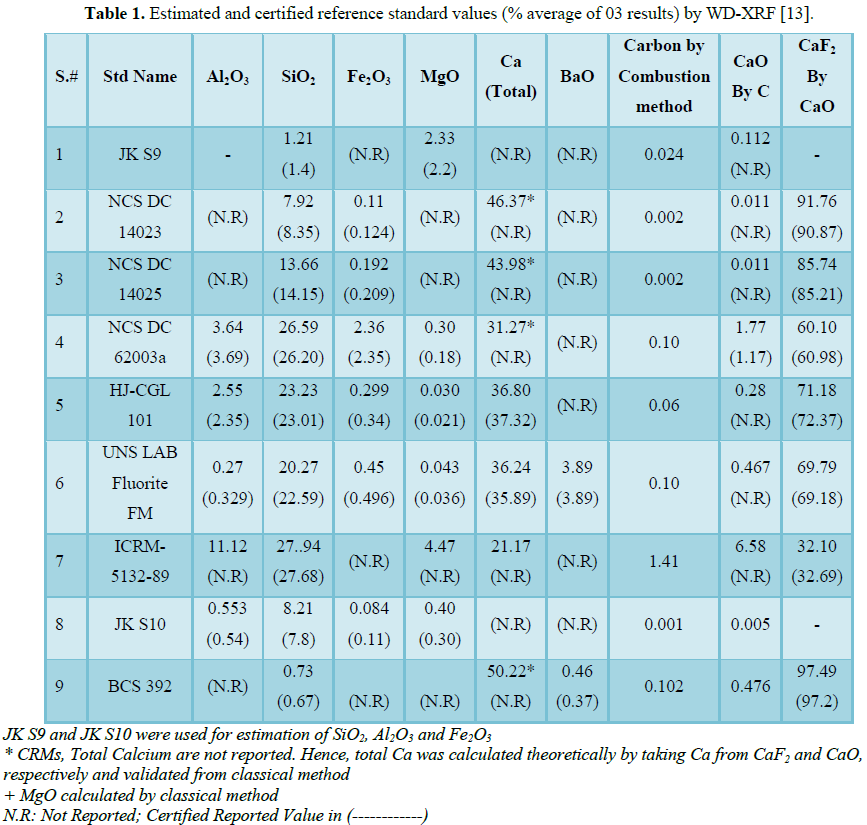
STANDARDS AND CALIBRATION
Initially calibration lines
of SiO2, Ca, P, SrO, BaO, Fe2O3 were developed
in WDXRF with known chemical composition of primary standards as well as
synthetic standards and same standards except synthetic standards were utilized
for carbon development calibration line in CS-800 analyzer. The following
primary standards were used for calibration of lines i- JK S9, ii- NCS DC
14023, iii- NCS DC 14025, iv- NCS DC 62003a, v- HJ-CGL 101, vi- UNS LAB
Fluorite FM, vii- ICRM-5132-89, viii -JK S10, ix- BCS 392 as well as utilized
high purity analytical reagents of silica (SiO2), calcium oxide
(CaO), calcium fluoride (CaF2), aluminum oxide (Al2O3),
magnesium oxide (MgO) and ferric oxide (Fe2O3) for
synthetic standards (Table 1).
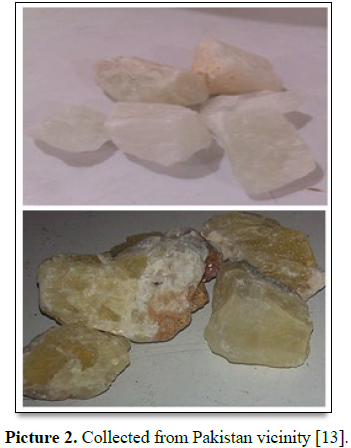
SAMPLES OCCURRENCE AND
COMPOSITION
40
samples were collected by random sampling from different locations of Pakistan
Jurassic Loralai limestone of Gadebar, Daman Ghar, tor Thana, Wategam, Mekhtar,
Balao, Mahiwal areas of Loralai District. The fluorite of Loralai area occurs
as veins and as disseminated grains along faults and fractures which is hosted
by the Jurassic Loralai limestone forming the anticlinal core. Fluorite has
many colors such as pink, blue, light-grey, green and light-yellow (Picture 2).
Chemical analysis shows CaF2 varies from 95.20-95.40%, CaCO3
from 3.20-3.40% and SiO2 from 1.40-1.44%. Average weight %
concentration of Ca is 49%, F is 45%, SiO2 is 2.30%, CuO is 0.5%, Al2O3
is 2%, Fe2O3 is 0.08% and LOI is 1.47%. This type of
fluorite can be used for acid preparation and also as gemstones.
Homogeneity of
samples through grinding method, grinding time, mesh size, pelletized force
binder type and ratio. After said process samples passed through 150 µm and
oven dry at 105°C for 24 h and observed lose 0.001-0.10%.
CARBONATES
CONFIRMATION BY VOLATILIZATION, ATR-FTIR AND XRD PROCEDURE
CaF2
mineralogy having major compound of CaCO3 with respect to other
carbonates. This was confirmed by volatilization method at different
temperatures. The decomposition temperatures showed that calcium carbonate is
present as main constituent as well as presence of CaCO3 was
confirmed by Thermo Nicolet iS5 FTIR (Figure 1) with ZnSe (refractive
index 2.67) [14-19]. Mineralogy of compounds was determined by Expert Pro XRD
instrument which confirmed (Figure 2) the presence of CaCO3
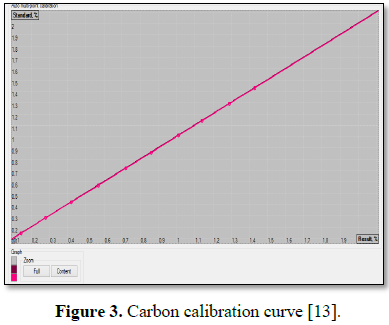
instead of other compounds [20]. Carbon analyzed for estimation Ca by
mathematical calculation by IR method (Figure 3).
RESULTS AND
DISCUSSION
Why pressed sample instead of bead sample?
The published
application was particularly designed for all type of fluorspar in pressed
pellet samples. Fluorine has low molecular weight and decomposes during
825°C-1330°C [21].
Hence due to this
possible loss of fluorine may occur during calcinations. So, it is ineffective
to estimate by fused bead sample.
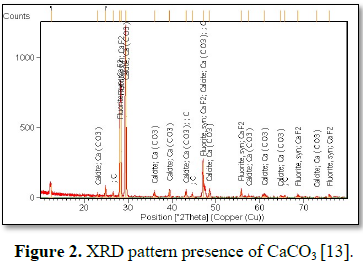
Mineralogy by XRD
Fluorspar samples
mineralogy were identified by XRD patterns and illustrated the presence of
alkaline earth carbonate as CaCO3 and CaF2.
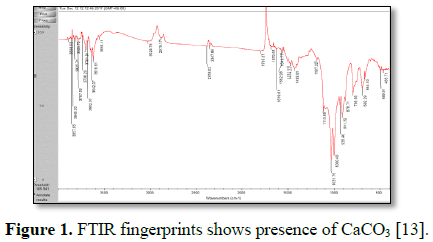
FTIR illustrations
The characterized
FTIR confirmed the presence of CaCO3 in fluorspar. The presence of
infrared spectrum of the CaCO group starching of carbonates on 713, 875 and
1418-1473 cm-1 it shows the absorption bands of CaCO3
(Calcite) [22,23].
Analysis of carbon and CaF2
calculation
Total carbon in
certified reference material were used for calibration after analysis by
combustion method and observed regression factor R2=0.999 which
shows the linearity of calibration line. Theoretical carbon value was used for
calculation of CaCO3 present in standards samples the accuracy of
carbon direct related to CaF2.
The following
conversion factors used during development of application:
Total Ca to CaF2=
[Total Conc (“Ca”) - (Conc (“C”) × 4.665) × 0.715)] × 1.95
Apply factors during
application development
i- C to CaO=4.665; ii- CaO to Ca=0.715; iii- Ca to CaF2=1.95
Significant impact on method
The published
application quantify the concentration as total carbonates in the presence of
other carbonates such as Mg, Na and Ba, etc., instead of CaCO3, the
developed method has limitation to distinguish/separate the carbonates attached
with alkali and alkaline earth metals other than CaCO3 and it cause
significant impact on method. The analysis by different techniques shows that
natural fluorspar has major contents of CaCO3 with respect to other
carbonates. Therefore on the bases of several analytical observations the
developed application has no significant impact in the presence of other
carbonates in minor quantity on estimation of CaF2.
Specificity of invention
The invented method
has less background corrections, line overlaps and measuring time with respect
to other developed methods and classical estimations. The primary and in-house
established standards have no interference to each other. The complete analysis
time for standard and sample was just 340 s.
Method validation
The current invented
method has been verified by method validation before implementation in
industry. For validation different statistical tools such as standard
deviation, recovery (R, %), relative percent difference (RPD, Eq. (1)),
instrument detection limit (IDL), limit of quantization (LOQ), method detection
limit (MDL) and uncertainty (Ua), were used. The same method was verified by
classical method and observed that both values were approximately same.
RPD= 100 × (Value 2 - Value 1) / (Value 2 + Value 1)/2 (1)
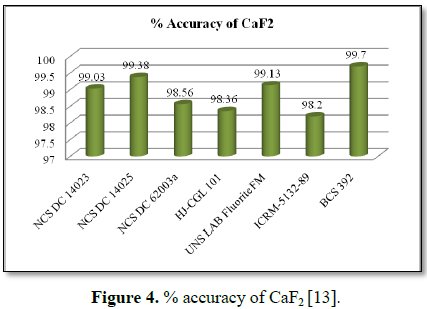
Accuracy of fluorspar values
Accuracy of the CaO and CaF2
directly related to estimation of carbon observed values and values used in
calibration of carbon line (Figure 3). The accuracy of CaF2
primary certified standards results is illustrated in terms of bar chart (Figure
4).
Method validation and proficiency test results
This commercial method has
also verified by the proficiency test method. The proficiency results (Table
2) shows that invented method is used as commercial for all type of
fluoride grades and accurate for determination of CaF2.
Novelty of work
How we can say the published
work is novel as compare to classical and other published methods? On the basis
of significant of current work with respect to non-hazardous, time saving,
customer beneficial, industrial application and less error observed values of
standards and samples with related classical method and minimum z-score and
statistically significant Accuracy and
precision of the results obtained through invented method was more consistent
as compared to other method due to less human influence.
CONCLUSION
This paper “Quantification of metallurgical flux by wavelength dispersive x-ray fluorescence” was selected as a review of the method advancement in the field of inorganic chemistry.
Before said method
the CaF2 was estimated by classical method as described in American
standard testing method (ASTM-E1506) and some other methods have developed for
estimation of fluoride by combination with classical and instrumental
techniques but still not used in industry.
The published method
is advanced methodology for the determination of fluoride by instrumental
technique. It is the first step towards the novel development in short term
technique, improved performance and less hazardous with respect to classical
method. Finally by taking an overview of the current technique it is strong
support to analyst with confidence and opportunity towards the new approach in
the field of chemistry. At present we have further modify the published method
and can analyze complete estimation with WDXRF without using carbon analyzer.
ACKNOWLEDGMENT
The authors are highly grateful to “Mr. Syed Sajid Hussain”, Peoples Steel Mills Ltd for help in analysis.
1. Douglas
H. “fluorite”. Online etymology dictionary. Available at: https://www.etymonline.com/word/fluor
2. Douglas
H. “spar”. Online etymology dictionary. Available at: https://www.etymonline.com/word/spar
3. Hurlbut
CS, Klein C (1985) Manual of Mineralogy (after James D Dana)/Cornelis Klein,
Cornelius S Hurlbut Jr. 20th Edn, pp: 324-325. ISBN 0-471-80580-7.
Available at: https://trove.nla.gov.au/work/8455391
4. Miessler
GL, Tarr DA (2003) Inorganic Chemistry. 3rd Edn. Pearson/Prentice
Hall Publisher. Available at: https://www.amazon.ca/Inorganic-Chemistry-5th-Gary-Miessler/dp/0321811054
5. Aigueperse
J, Mollard P, Devilliers D, Chemla M, Faron R, et al. (2000) Fluorine
Compounds, Inorganic. Wiley Online Library. Available at: https://onlinelibrary.wiley.com/doi/full/10.1002/14356007.a11_307
6. Aigueperse
J, Mollard P, Devilliers D, Chemla M, Faron R, et al. (2005). Fluorine
Compounds, Inorganic. Ullmann's Encyclopedia of Industrial Chemistry. Weinheim:
Wiley-VCH.
7. Wiberg
E, Wiberg N, Holleman AF (2001) Inorganic Chemistry. Academic Press: San Diego.
Available at: https://www.worldcat.org/title/inorganic-chemistry/oclc/48056955
8. Michael
MM (2009) Fluorspar. USGS Minerals Yearbook. Available at: https://minerals.usgs.gov/minerals/pubs/commodity/fluorspar/myb1-2009-fluor.pdf
9. Yang
C, Chaoyan C (2016) Determination of CaF2 in iron ore tailings by EDTA
complexometric titration. Chinese Journal of Inorganic Analytical Chemistry 6:
20-24.
10. 10.
Xian Y (2014) Analysis of component in fluorite using pressed powder pellet
x-ray fluorescence spectrometry combined with infrared spectroscopy. China
Inorganic Analytical Chemistry 4: 50-52.
11. Ma A,
Feng S (2012) Method of measuring component contents in fluorite by applying X
fluorescence powder tablet pressing method. Faming Zhuanli Shenqing CN
102809578.
12. Li S,
Du C, Zhang H (2011) Determination of TFe, SiO2, P, CaO, MgO in
sponge iron by x-ray fluorescence spectrometry. Lihua Jianyan Huaxue Fence 47:
1162-1164.
13. Akhter
N, Mumtaz M, Hussain SS (2018) Quantification of metallurgical flux by
wavelength dispersive x-ray fluorescence. Chem Sci J 9: 1-17.
14. Nishikawa
M, Batdorj D, Ukachi M, Onishi K, Nagano K, et al. (2013) Preparation and
chemical characterisation of an Asian mineral dust certified reference
material. Anal Methods 5: 4088-4095.
15. Maitra
S, Chakrabarty N, Pramanik J (2008) Decomposition kinetics of alkaline earth
carbonates by integral approximation method. Ceramica 54: 268-272.
16. Valverde
JM, Perejon A, Medinac S, Perez-Maquedad LA (2015) Thermal decomposition of
dolomite under CO2: Insights from TGA and in situ XRD analysis. Phys
Chem Chem Phys 17: 30162-30176.
17. Mazzeo
R, Joseph E, Prati S, Millemaggi A (2007) Attenuated total reflection Fourier
transform infrared microspectroscopic mapping for the characterization of paint
cross sections. Analytica Chimica Acta 599: 107-117.
18. Zhang
WR, Lowe C, Smith R (2009) Depth profiling of coil coating using step-scan
photoacoustic FTIR. Progress in Organic Coatings 65: 469-476.
19. Stuart
(2004) Infrared Spectroscopy: Fundamentals and Applications B. John Wiley &
Sons, Ltd ISBNs: 0-470-85427-8 (HB); 0-470-85428-6 (PB).
20. Pandey
GC, Kulshreshtha AK (1993) Fourier transform infrared spectroscopy as a quality
control tool. Process Control and Quality 4: 109-123.
21. Schmidbaur
H (1985) Greenwood VNN, Chemistry of the Elements. Von N. N. Greenwood und A.
Earnshaw. Pergamon Press, Oxford 1984, 1542 S., geb. $ 95.00. ‐ ISBN
0‐08‐022056‐8; Paperback $34.95: ‐ ISBN 0‐08‐022057‐6. Wiley Online Library.
22. Meejoo
S, Maneeprakorn W, Winotai P (2006) Phase and thermal stability of nanocrystalline
hydroxyapatite prepared via microwave heating. Thermochimica Acta 447: 115-120.
23. Ratner
B, Hoffman A, Schoen F (2004) An Introduction to Materials in Medicine. In:
Biomaterials Science. 2nd Edn. Academic Press, p: 851.
-
 Table 1
 -
Table 2


")